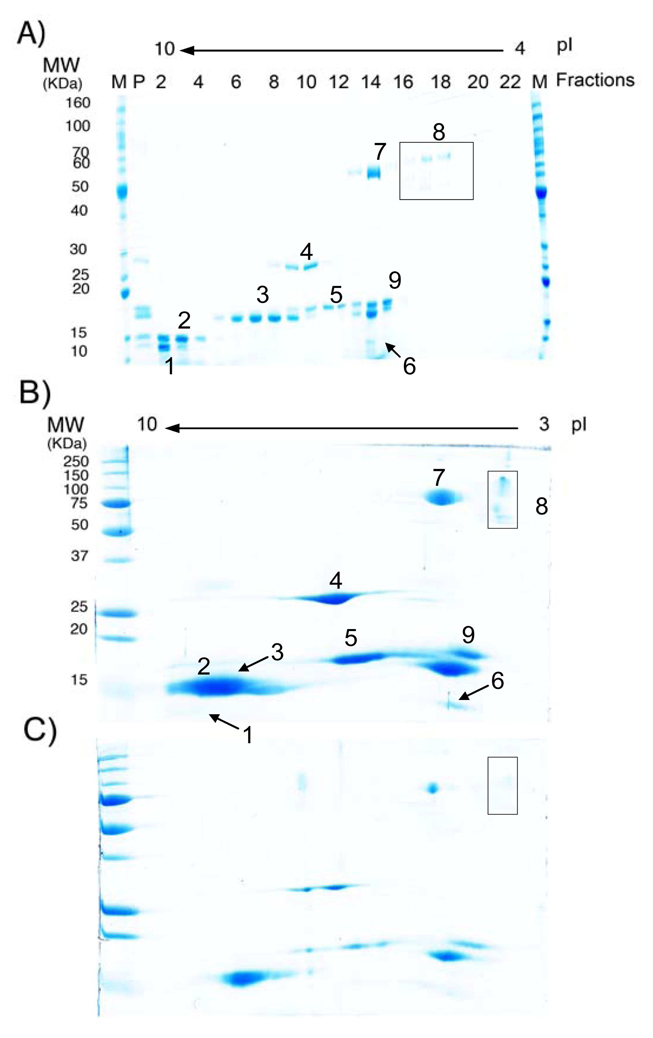
Figure 6.
Comparison of protein separation using A) FF-IEF/SDS-PAGE system, B) 2D gel IEF-electrophoresis, high loading (total protein load of 50 µg), and C) 2D gel IEF-electrophoresis, low loading (total protein load of 10 µg).. Protein samples: 1) Cytochrome C, pI 9.5–10.7, 12.4 kD; 2) Ribonuclease A, pI 9.5, 13.7 kD, 3) Lectin, pI 8.3, 8.0 and 7.8, 17 kD; 4) Carbonic anhydrase, pI 6–6.6, 29 kD; 5) Myoglobin, pI 6.9–7.4, 17.8 kD; 6) β-Lactoglobulin, pI 5.3 and 5.2, 14 kD; 7) Glucose oxidase, pI 5.5, 77 kD; 8) Amyloglucosidase, pI 5, 89 kD and 70 kD. 9) Trypsin inhibitor, pI 4.5, 21.5 kD. Lane markers correspond to marker (M), sample mixture for positive control (P) or device fraction number (high to low pH). Loading [total protein] for FF-IEF system: 1 mg/mL. IEF fractionation flow rate: 1 mL/hr.

