
Figure 4.
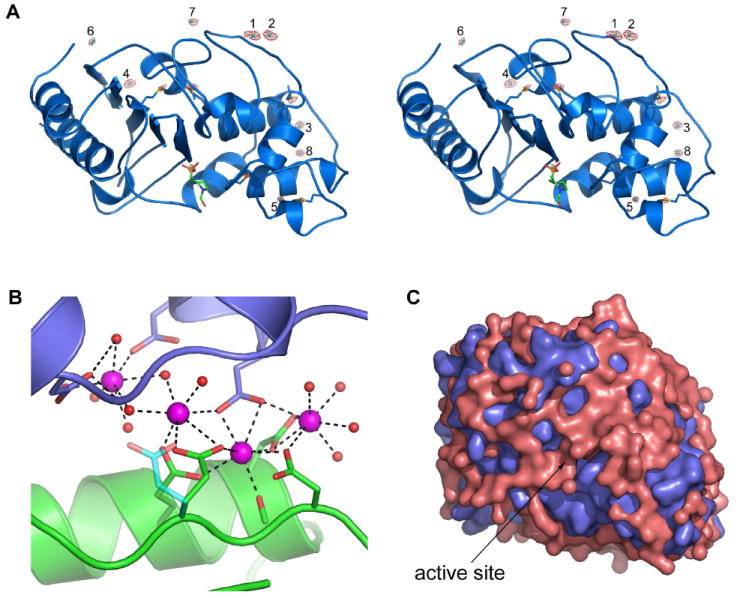
Calcium and water on the surface of OIH-1. (A) Stereoview of the anomalous difference map calculated from the 1.25 Å data. The map was contoured at 4σ and the anomalous peaks are shown in red. The eight calcium ions are labeled 1 to 8. The additional peaks are due to the sulfur atoms of the six methionine residues (indicated as blue sticks), and the sulfur atom in the HEPES molecule bound in the active site (shown in green sticks). (B) The calcium/solvent cluster at the interface between two OIH-1 molecules (colored green at the bottom and blue at the top). The four calcium ions are colored magenta and the associated water molecules as red spheres. (C) The molecular surface of OIH-1 (blue) overlaid with a surface representation of the 515 bound water molecules (pink) to show the extensive nature of the solvent networks.