Fig. 2.
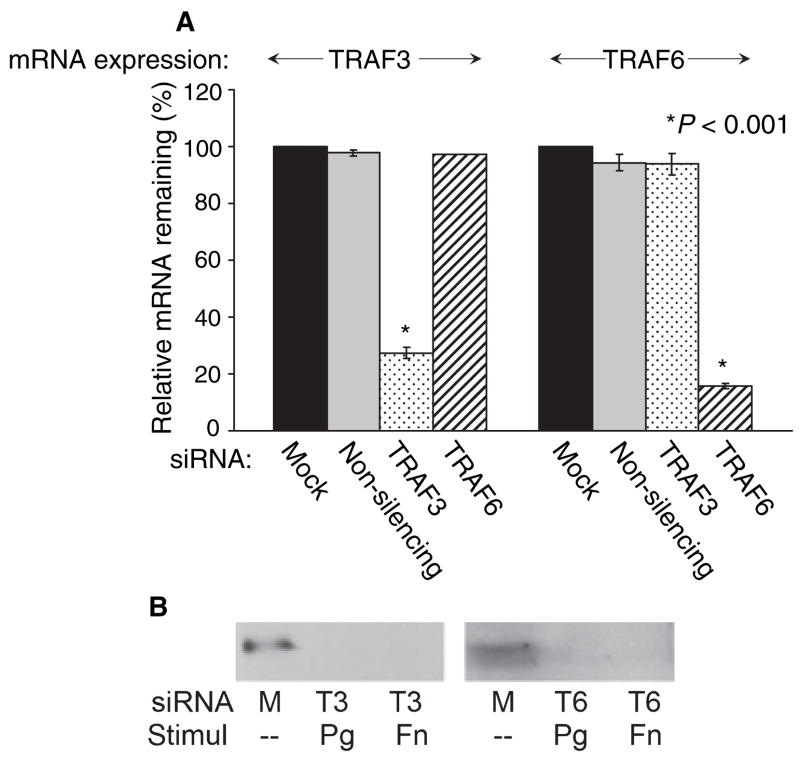
Successful gene knockdown after siRNA transfection was determined at the mRNA and protein levels. (A) GECs after control (mock and non-silencing)- or TRAF6 siRNA-transfection show strong TRAF3 mRNA expression, while after TRAF3 siRNA-transfection show TRAF3 mRNA expression level at 27% (left). A parallel RT-PCR was performed to test TRAF6 mRNA expression level after transfection with TRAF3 or TRAF6 siRNA (right). TRAF6 mRNA expression is reduced to 15%. Three different cell lines were tested, and the average values, with standard deviations, are shown. (B) Whole cell protein extract from GECs after mock-transfection show strong TRAF3 protein expression, while after TRAF3 siRNA-transfection (T3) show decreased TRAF3 protein expression (left). The results are the same regardless of subsequent stimulation with pathogenic (Porphyromonas gingivalis: Pg) or commensal (Fusobacterium nucleatum: Fn) bacteria. A parallel study was done to determine TRAF6 protein level after transfection with TRAF6 siRNA (T6) (right).

