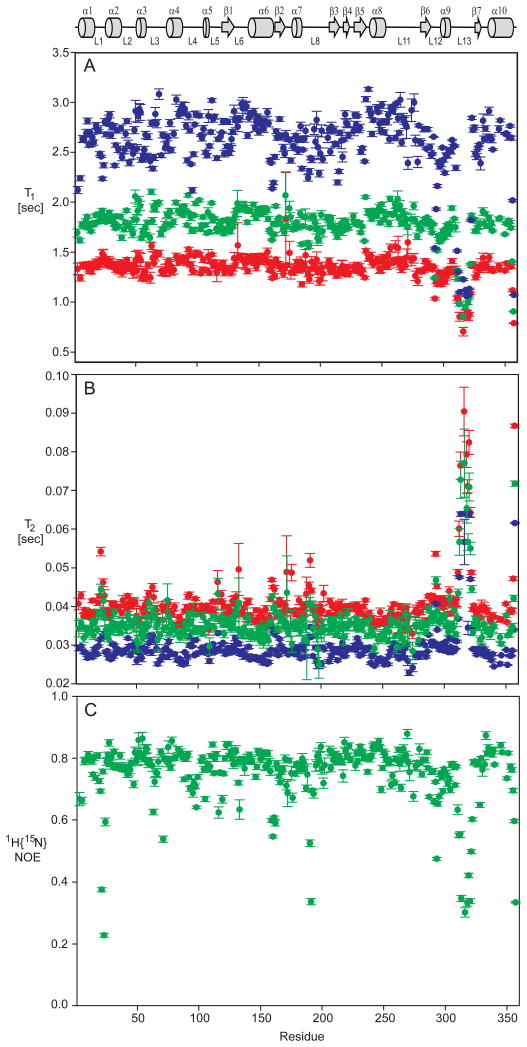
Figure 5.
15N NMR spin relaxation time constants (a) T1, (b) T2 and (c){1H}15N NOE for arginine kinase at 15N Larmor frequencies 50.65 (red), 60.78 (green), and 81.04 MHz (blue). Individual values are listed in Supplemental Table 1. Error bars on each measurement represent one standard deviation. The T1rho spin lock time at 50.65 and 60.78 MHz was shorter than optimal for the slow relaxing amide signals in loop L13 resulting in relatively large errors. A schematic diagram of arginine kinase secondary structure is shown at the top with α-helices shown as cylinders, β-strands as arrows, and loops and extended structure as lines.

