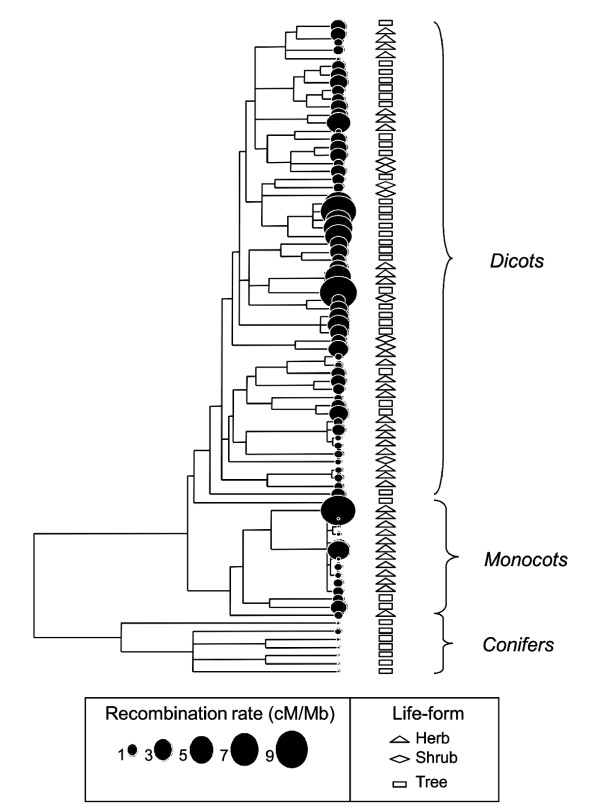
Figure 2.
Phylogenetic distribution of the genome-wide rate of recombination for 81 higher plant species classified according to their life-form. Dot sizes are proportional to the recombination rate following the scale shown below the tree. The life-form of each species is indicated by rectangles (trees), diamonds (shrubs) or triangles (herbs) in front of each clade.

