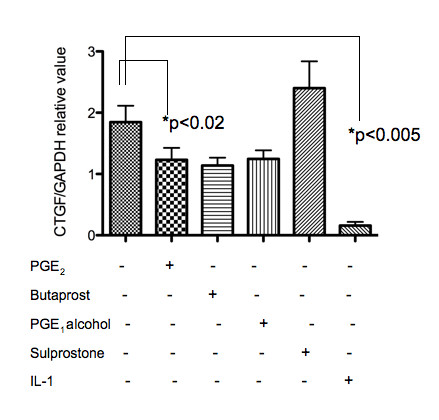
Figure 1.

Quantitative PCR for CTGF expression in PGE2- or EP receptor agonist-stimulated human chondrocytes. Chondrocyte samples (n = 5, in duplicate) were either stimulated or not stimulated with PGE2 (10 nM), butaprost (10 μM), PGE1 alcohol (10 nM), sulprostone (1 μM), or IL-1β (10 ng/ml) for 24 h in vitro. The relative expression of CTGF mRNA was calculated against values of the internal control GAPDH.
