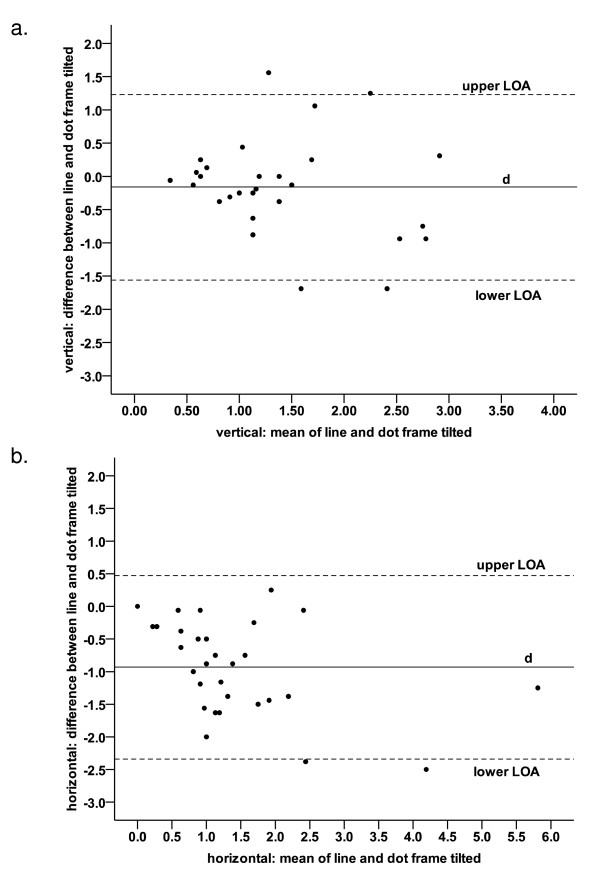
Figure 3.
Bland and Altman plots showing agreement between line and dots. Bland Altman plots of method agreement comparing the use of a line versus dots to test for subjective visual vertical (a) and horizontal (b) when the frame is tilted (n = 30). Solid line represents the mean difference of errors (d) while the dashed lines represent the upper and lower limits of agreement.

