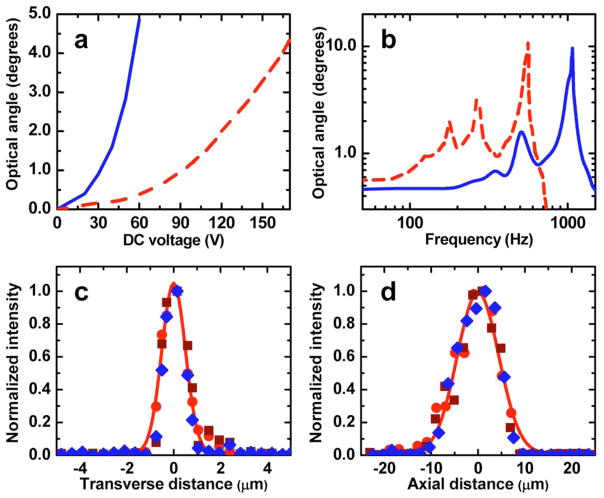
Fig. 2.
(Color online) a, Optical deflection angle versus dc voltage, and b, frequency response function for inner (blue solid curve) and outer (red dashed curve) axes of a 1 mm ×1 mm MEMS scanner. For each axis time-varying signals were applied to one of the two opposing comb banks. c, Lateral and d, axial resolutions were determined as the FWHM of curve fits (Airy function squared, c, and Gaussian, d) to normalized, cross-sectional images of 100 nm diameter fluorescent beads. Data from three beads (circle, square, and diamond symbols) and fits from one bead (solid curves) are shown.

