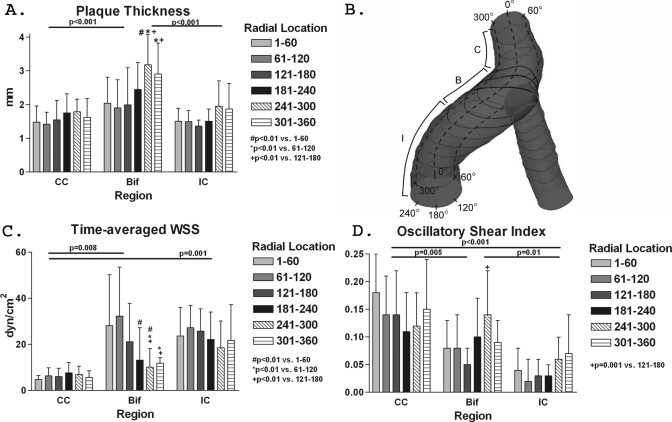
Figure 5.
Regional segmental and circumferential distribution of plaque, WSS, and OSI. There is regional segmental and circumferential variability in (a) plaque thickness, (c) time-averaged WSS, and (d) OSI. In the bifurcation region, the circumferential variability in WSS and OSI closely follows plaque distribution. The regional segmental and circumferential designations are depicted in (b).

