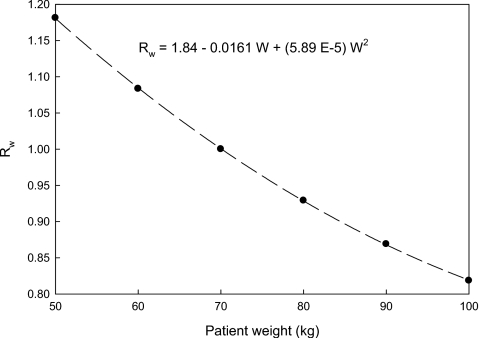
Figure 3.
Plot of Rw as a function of adult patient weight (w), which shows how the organ doses vary with patient weight relative to a 70 kg patient (where R=1). Rw was generated by modeling patients as equivalent cylinders of water using Eq. 4. The dashed line is a least-squares fit to the data (r2>0.99) whose coefficients are given in the equation relating Rw to W.

