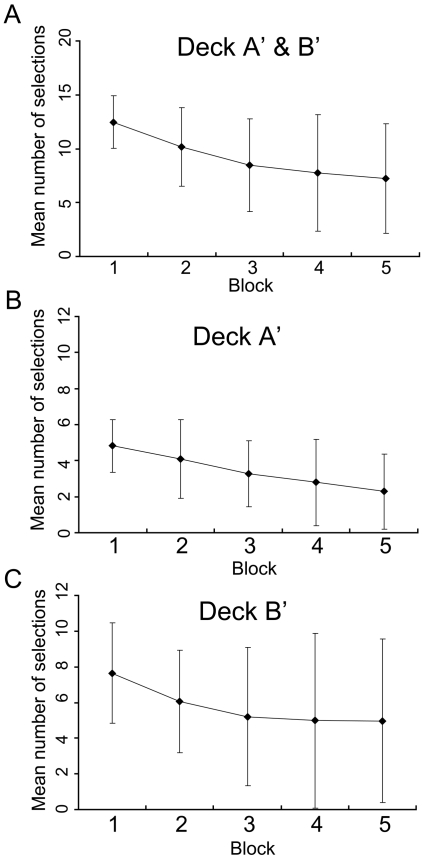
Figure 1. Mean number of high-risk/high-return choices across trials along with standard deviations.
A total of 100 trials were divided into 5 blocks of 20 trials. The total number of selections from deck A' and deck B' decreased across trials (A). Selections from deck A' monotonously decreased (B). However, selections from deck B' initially decreased but later did not decrease. (C). Moreover, towards the end of the IGT, the deviations became larger regarding selections from deck B'.

