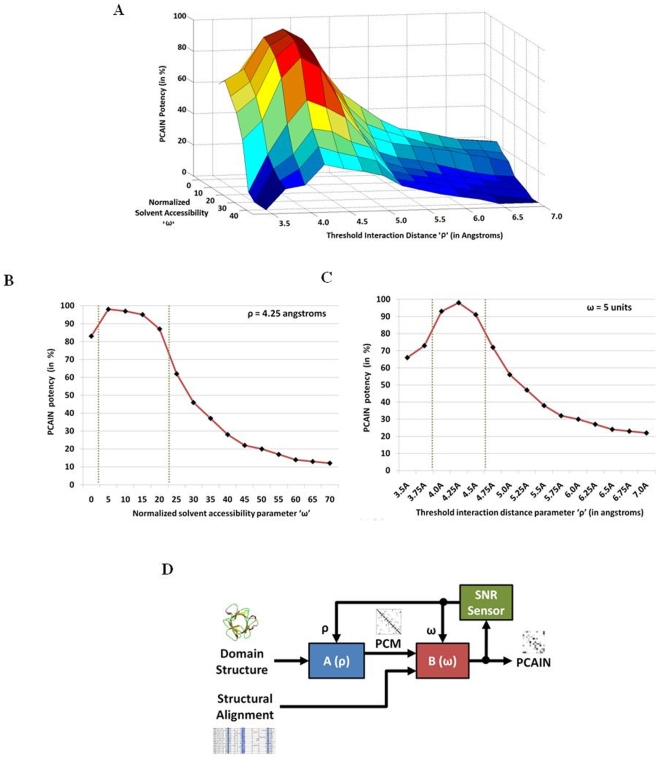
Figure 5. PCAIN as a function of threshold interaction distance (ρ) and conserved solvent accessibility (ω) parameters.
(A.) Variation of PCAIN potency (difference between averaged intra-fold and inter-fold PCAIN correlations) with threshold interaction distance ρ and conserved solvent accessibility ω. (B.) At fixed ρ = 4.25 angstroms, the variation of PCAIN potency with ω. (C.) At fixed ω = 25, the variation of PCAIN potency with ρ. (D.) Implementation of adaptive tuning of ρ and ω parameters for maximizing SNR.

