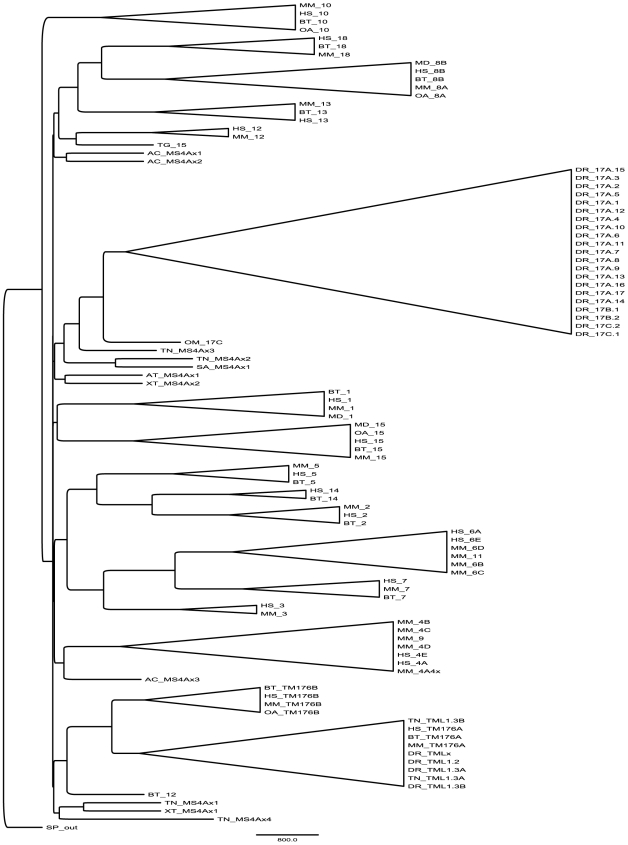
Figure 2. Phylogram of MS4A and TMEM176 families.
Using the multiple sequence alignment shown in Supplementary Figure S1, a phylogeny was generated of all sequences listed in Supplementary Table S2, using a sequence from S. purpuratus to root the tree (SP_out). The expanded phylogenetic tree with bootstrap values is shown in supplementary Figure S2.

