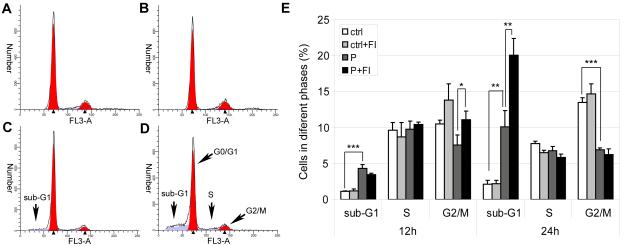
Fig. 4.
Cell cycle analysis of cells treated with desired medium. (A) In control for 24 hrs (ctrl). (B) In control supplemented with 10 μM forskolin and 100 μM IBMX (FI) for 24 hrs (ctrl+FI). (C) In 0.7 mM palmitate for 24 hrs (P). (D) In 0.7 mM palmitate supplemented with FI for 24 hrs (P+FI). (E) Quantification of cells in sub-G1, S and G2/M phases 12 hrs and 24 hrs after treatment (n=3). *: p<0.05; **: p<0.01; ***: p<0.001.

