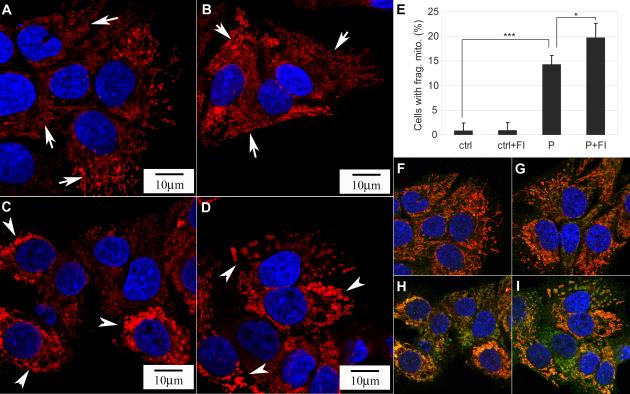
Fig. 7.
(A-D) Mitochondrial morphology of cells in (A) control, (B) control supplemented with 10 μM forskolin and 100 μM IBMX (FI), (C) 0.7 mM palmitate and (D) 0.7 mM palmitate supplemented with FI for 24 hrs (n=3). (A-B) exhibited elongated and tubular structure, while (C-D) displayed short and disconnected morphology. (E) Quantification of the percentage of cells with fragmented mitochondria as displayed in (A-D) (n=3). *: p<0.05; ***: p<0.001. (F-I) Immunostaining of mitochondria (red), Smac (green) and nucleus (blue) for cells in (F) control, (G) control supplemented with FI, (H) 0.7 mM palmitate and (I) 0.7 mM palmitate supplemented with FI for 24 hrs (n=3).

