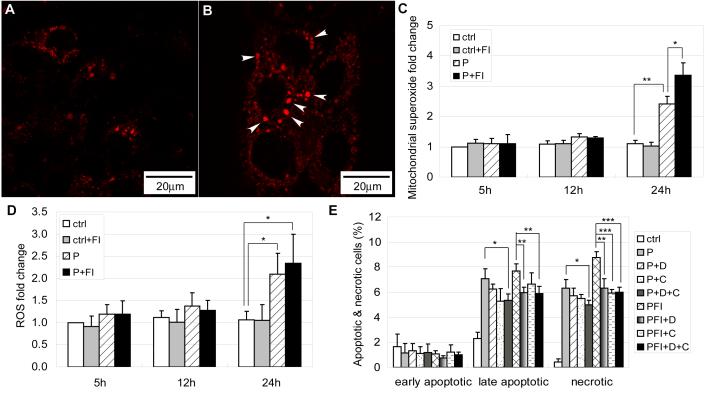
Fig. 9.
(A) Mitochondrial superoxide labeling for cells in control and (B) cells treated with 0.7 mM palmitate for 24 hrs. Arrow heads denotes short and disconnected mitochondria which have higher superoxide levels (n=3). (C) Mitochondrial superoxide levels fold change for cells in control and 0.7 mM palmitate without (w/o) or with (w/) 10 μM forskolin and 100 μM IBMX (FI) for 5 hrs, 12 hrs and 24 hrs (n=4). (D) Cellular ROS levels fold change for cells in control and 0.7 mM palmitate without (w/o) or with (w/) 10 μM forskolin and 100 μM IBMX (FI) for 5 hrs, 12 hrs and 24 hrs (n=3). (E) Apoptotic and necrotic labeling by PI (propidium iodide) and Alexa Fluor-488 conjugated annexin V for cells in control, 0.7 mM palmitate (P) and 0.7 mM palmitate supplemented with 10 μM forskolin and 100 μM IBMX (FI) in the presence of ROS inhibitors (n=3). D: hydroxyl radical inhibitor DMU; CA: hydrogen peroxide inhibitor catalase. *: p<0.05; **: p<0.01; ***: p<0.001.

