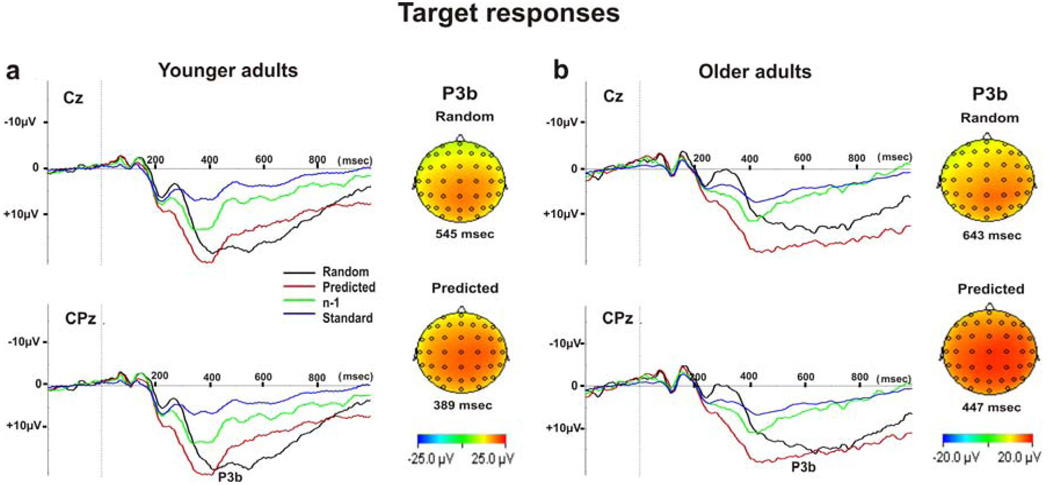
Figure 3.
Grand average at Cz and CPz for the 4 conditions: targets after random non-predictive (Random) and predictive sequences (Predicted), the last most informative standard comprising the predicting sequence (n−1) and random preceding standards (Standard) for young (a) and older (b) adults. Vertical dotted line indicates time of stimulus presentation onset. Topographical maps for the maximal peak P3b at CPz are shown for random and predicted targets.

