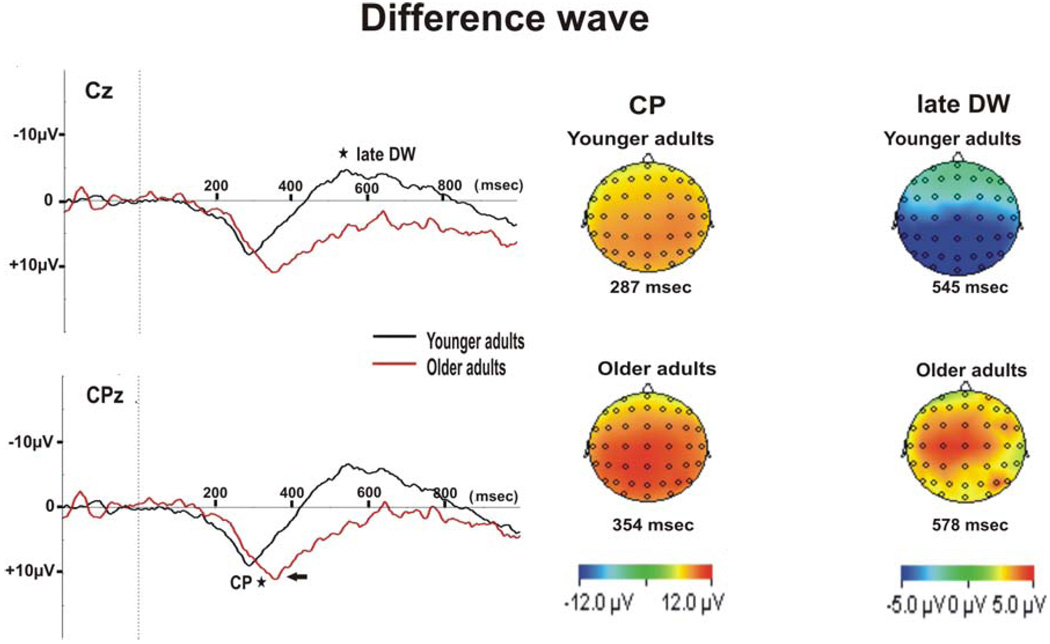
Figure 4.
Grand average for the difference wave (DW) between predicted and random targets at Cz and CPz in young and older adults. The peak of the context positivity (CP) is indicated by an arrow. Topographical maps the CP peak at CPz and for late DW at Cz, for young and older adults are displayed. Age-related differences (p < 0.05) in peak CP latency at CPz and in late DW mean amplitude (400–800 msec post stimulus onset) at Cz are indicated by a star.

