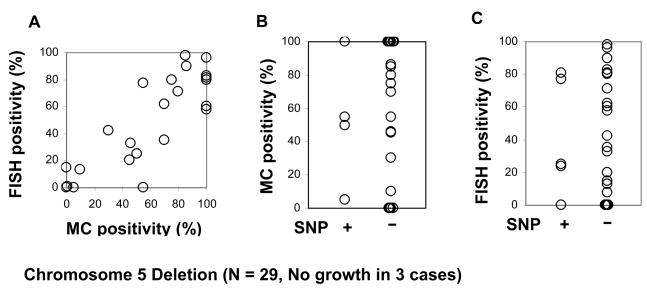
Figure 2. Comparison of detection rates of MC, FISH and SNP-A.
A. FISH results vs. MC results. A strong correlation was found when the proportion of del5q positive cells detected by FISH and the percentage of metaphase cells with del5q by MC were compared (r2 = 0.82, P<0.0001). B. MC results vs. SNP results. No correlation was found, likely due to the low fraction of clonal cells undergoing division in some patients. A similar observation was also made for del7/7q, trisomy8 and del20/20q (data not shown). C. FISH results vs. SNP results. No correlation was found between FISH and SNP-A findings.

