
Figure 1.
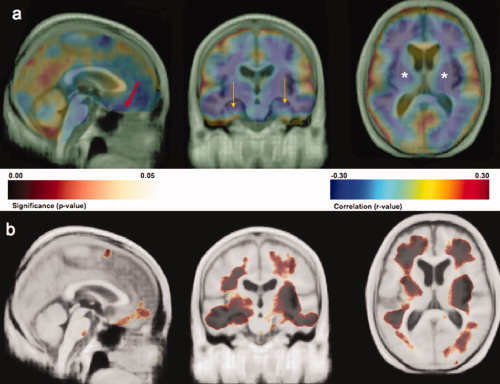
Part a shows an r‐value (Pearson correlation coefficient) map highlighting the negative and positive correlations between BMI and brain structure projected onto cardinal sections of the Cardiovascular Health Study Minimal Deformation Template (CHS‐MDT). Blue colors show stronger negative correlations while red and yellow colors show positive correlations; only negative correlations were statistically significant (p < 0.001; permutations test). An inverse association between BMI and brain volume is observed in orbital frontal cortex (red arrow at x = −9, y = 57, z = 29, r = −0.31), the hippocampus (gold arrows: left at x = −31, y = −2, z = 25, r = −0.32; right at x = 32, x = 9, z = 18, r = −0.31) and subcortical areas (white asterisks: left at x = −28, y = −14, z = 1, r = −0.30; right at x = 29, y = −15, z = 1, r = −0.34) including the putamen, globus pallidus, and thalamus. Part b shows a P‐value image of BMI main effects on brain structure projected onto the CHS‐MDT. All images are in neurological convention (left on left). Dark colors indicate atrophy in both GM and WM; darker colors denote lower P‐values. [Color figure can be viewed in the online issue, which is available at www.interscience.wiley.com.]