
Figure 4.
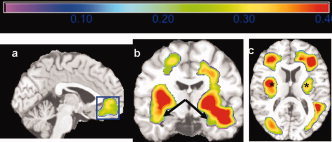
This figure shows a map of correlation values (r‐value map) projected onto the Standard Single Subject MNI brain template for display purposes. The correlation shown is between higher BMI and GM/WM atrophy controlling for age, gender, race, and DM2. Hotter colors denote stronger correlation effect sizes, which range from 0 to 0.4. Higher BMI was associated with lower GM and WM volumes in orbital frontal cortex (a, blue box), anterior cingulate gyrus (a, blue box), medial temporal lobe (b, black arrows), and subcortical WM (c, black asterisks). [Color figure can be viewed in the online issue, which is available at www.interscience.wiley.com.]