
Figure 5.
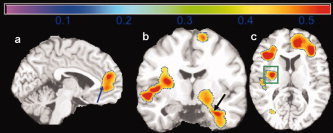
Correlation map (r‐value image) effect sizes for a comparison of 14 obese persons (BMI > 30) to 29 normal weight persons (18.5–25). Obese persons had lower GM and WM volumes in the frontal lobes, anterior cingulate gyrus (a, blue arrow), hippocampus (b, black arrow), and basal ganglia (c, green box). Correlation coefficients range from 0 to 0.5. [Color figure can be viewed in the online issue, which is available at www.interscience.wiley.com.]