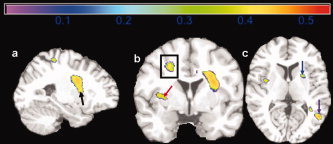
Figure 6.

Maps of correlation coefficients are shown for a group comparison of 51 overweight persons (BMI: 25–30) versus 29 normal weight persons (18.5–25). Atrophy in the overweight group is seen in the basal ganglia (a, black arrow; b, red arrow; c, blue arrow), corona radiata (b, black box), and parietal lobe (c, purple arrow). Correlations range from 0 to 0.5. [Color figure can be viewed in the online issue, which is available at www.interscience.wiley.com.]
