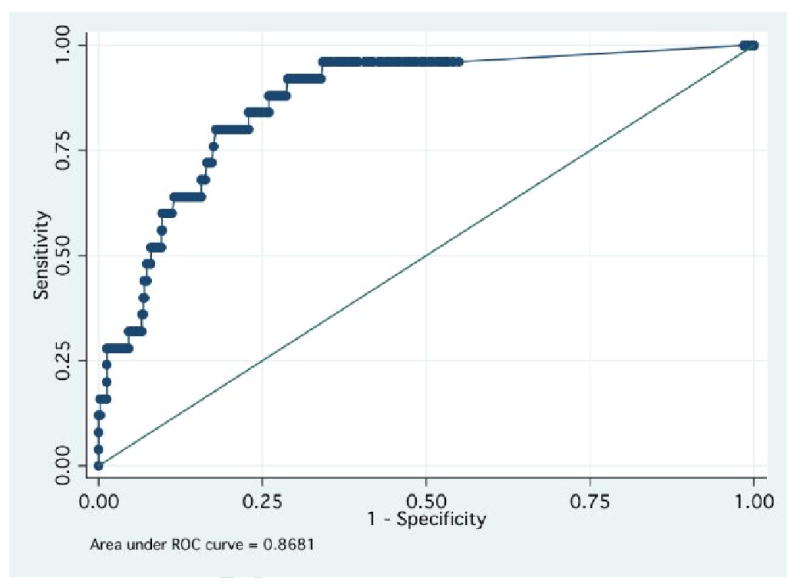
Figure 3. D-dimer receiver operator curve.

receiver operator characteristic curve demonstrating overall diagnostic performance of the HemosIL HS D-dimer. The Y axis plots sensitivity (true positive rate); the X axis plots 1-specificity (the false positive rate). The area under the curve is 0.87 with 95% confidence interval of 0.84 to 0.90.
