
Figure 5.
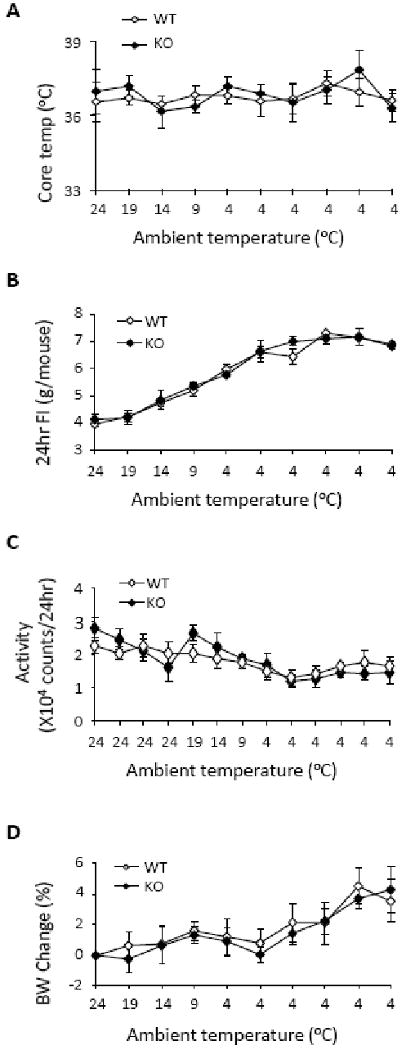
Adaptation of WT (n = 4) and KO (n = 4) mice to hypothermic challenge. A, core temperature did not differ between WT and KO mice at any time during the period of cold exposure. B, daily food intake (FI) increased as environmental temperature decreased, but was similar between genotypes. C, daily activity was measured continuously throughout the experiment and did not differ due to genotype. D, body weights (BW) did not differ between WT and KO mice either prior to or during cold exposure. Both WT and KO mice gained body weight during their exposure to cold.