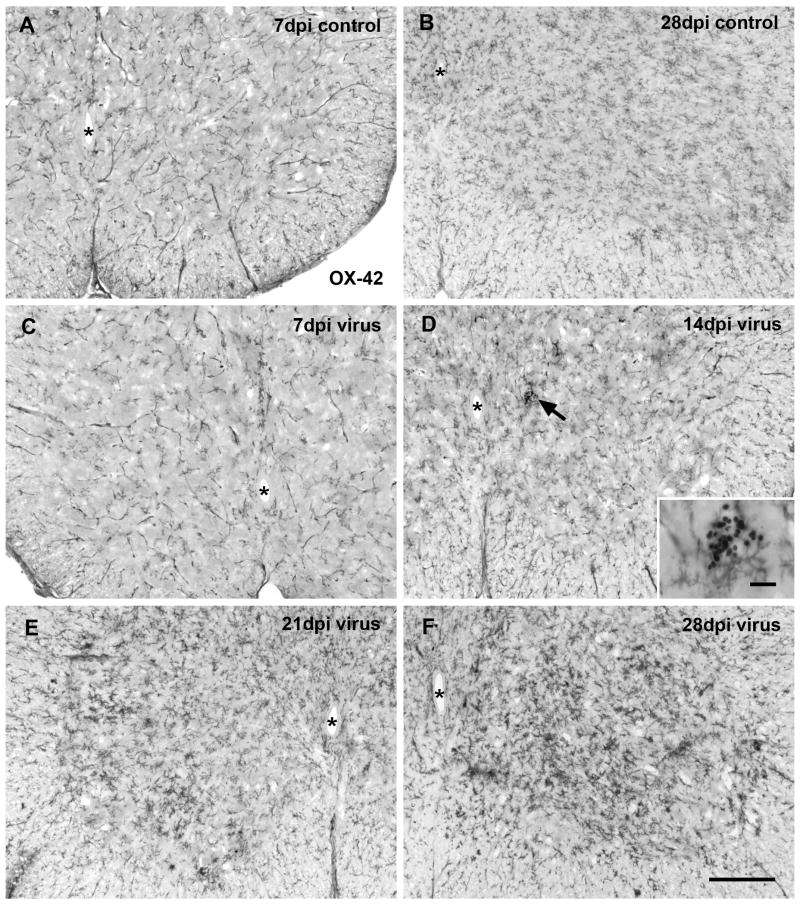
Fig. 1.
Microglia immunolabeled with OX-42 in the rat spinal cord ventral horn at different times after intracranial PVC-211 injection. (A, B) Sections from controls show normal distribution of microglia at 7 and 28 dpi. Note the increases in cell number and in differentiation during this period of postnatal development. (C-F) Virus infection does not result in apparent microglial activation at 7 and 14 dpi. A small intraparenchymal hemorrhage revealing peroxidase-positive erythrocytes is encountered in the spinal gray matter at 14 dpi without activated microglia nearby (arrow in D; enlarged in inset). Microglial activation is conspicuous in the spinal cord gray matter at 21 dpi (E) and has intensified by 28 dpi (F). Animals showed paresis (E) and paralysis (F) of hind limbs. Asterisks indicate central canal. Scale bar in F for all, 200 μm; inset, 20 μm.

