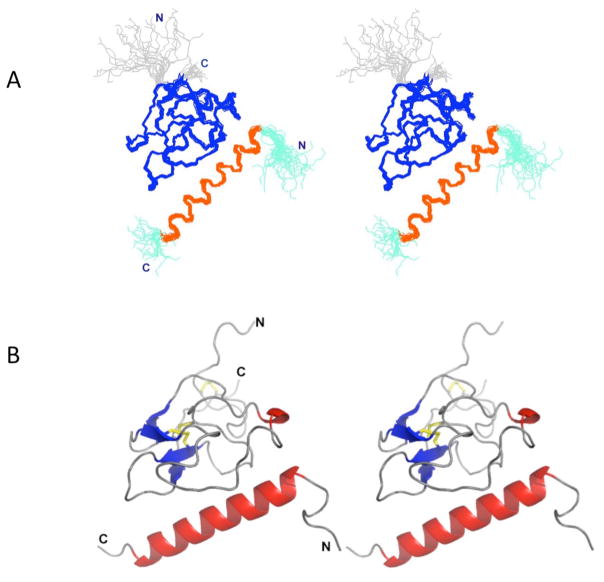
Fig. 1.
Stereo view of the solution structure of the VEK-30/K2Pg complex. (A). Backbone trace of the ensemble of 20 superimposed lowest energy structures. Color coding: Cys1-Cys78 of K2Pg and Ala6-Lys27 of VEK-30 are shown in blue and orange, respectively. The N- and C-termini of each chain are shown in gray (K2Pg) and cyan (VEK-30), respectively. (B). Ribbon representation of the lowest-energy structure. Helices are shown in red, β strands are shown in blue, coil and turn regions are shown in gray.

