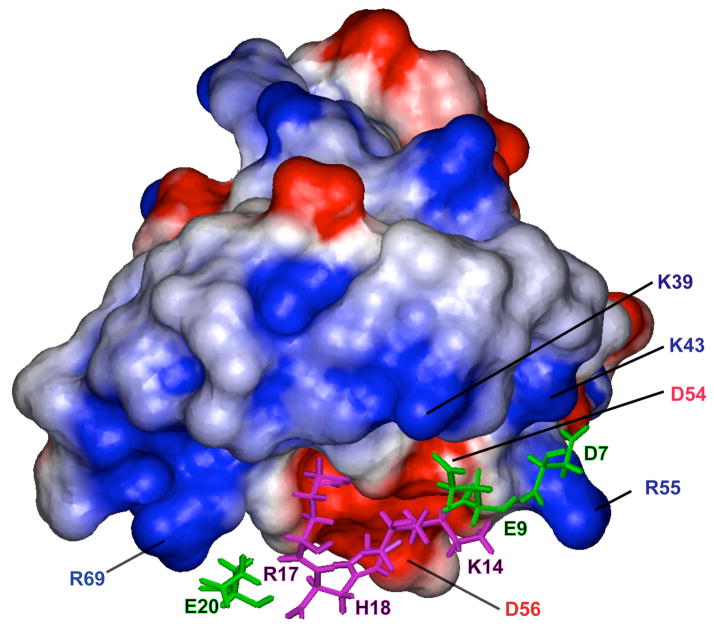
Fig. 4.
Electrostatic interactions between K2Pg and VEK-30. The K2Pg domain is shown in surface representation with color coding according to electrostatic potential (blue = positively charged, red = negatively charged). The side-chains of charged residues in VEK-30 interacting with K2Pg are represented as magenta and green sticks for positive- and negative-charged residues, respectively.

