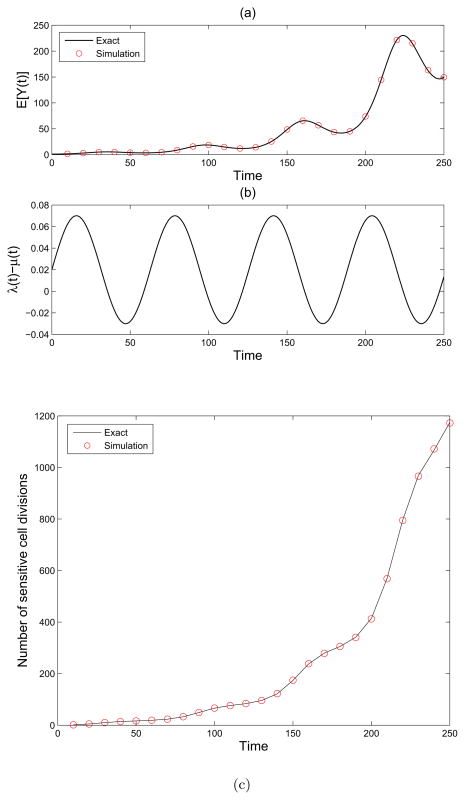
Figure 1.
A single-type non-homogeneous birth-death process. (a): Simulation (red circles) and theoretical (black line) mean of the single-type birth and death process Z(t) with birth rate λ(t) = 0.05 sin(0.1t) + .1, death rate μ(t) = .08 and initial population size M = 1. (b) We plot the net growth minus death rate λ(t) − μ(t) as a function of time. (c) We show the number of sensitive cell divisions for the process Z(t) with birth rate λ(t) = 0.05 sin(0.1t) + .1, death rate μ(t) = .08 and initial population size M = 1. Simulation (red circles) and theory (black line) are shown.

