Figure 4.
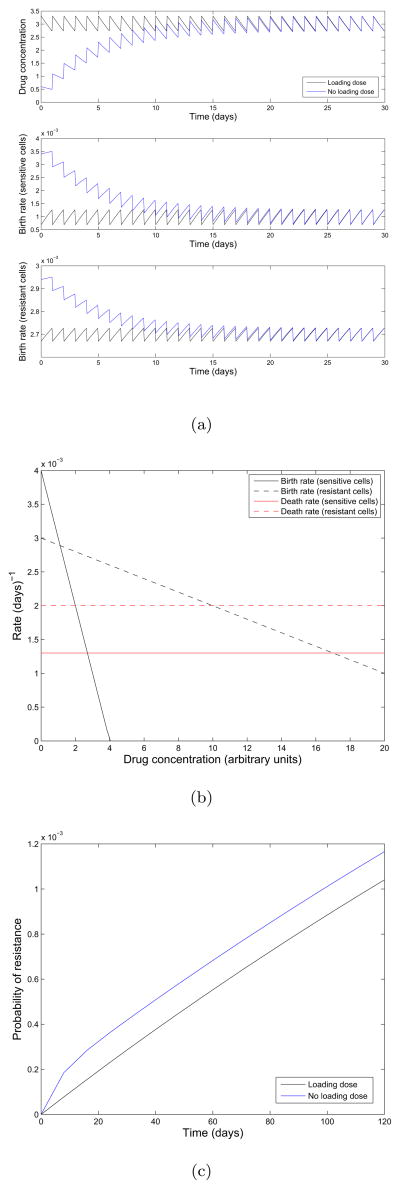
Consideration of pharmacokinetic effects on the evolution of resistance. (a)Top: Concentration over time, for a schedule using the loading dose (black) and the normal accumulating schedule (blue). Middle: Birth rate of sensitive cells as a function of time. Bottom: Birth rate of resistant cells as a function of time. We use a maintenance dose of size D = 0.6, dose spacing interval of τ = 1, a decay rate of κ = 0.2 which corresponds to a half life of approximately 83 hours, and a loading dose of size of size . The initial population is comprised of 106 sensitive cells and we assume a mutation rate of u = 10−8 per cell division. (b) Birth and death rates of sensitive (solid black and red) and resistant cells (dashed black and red) as a function of drug concentration. (c) Probability of resistance for dosing schedules with and without a loading dose.

