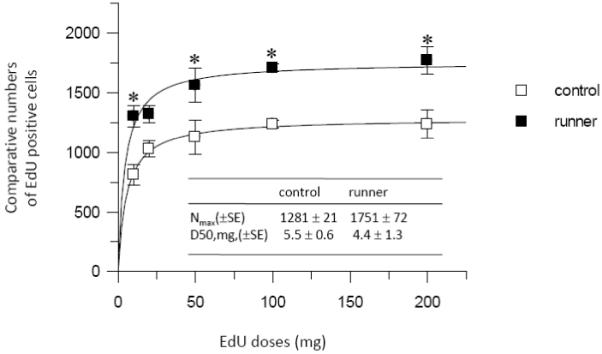
Fig. 2.

EdU dose–response experiment. Five groups (n=6) of two month old female mice received single injection of EdU intraperitoneally at a dose of 10, 20, 50, 100 or 200 mg/kg body weight. Four hours after EdU injection, brains were processed for EdU staining. EdU positive cell numbers slightly increased in a dose–dependent manner both in control and running mice. The data were fitted by Eq. A (see methods) to obtain a solid line from which Nmax and D50 values were calculated. SE stands for standard error. Bars represent mean ± SEM. * p < 0.05 in comparison to the control mouse group is considered significant using a two–tailed Student’s t–test.
