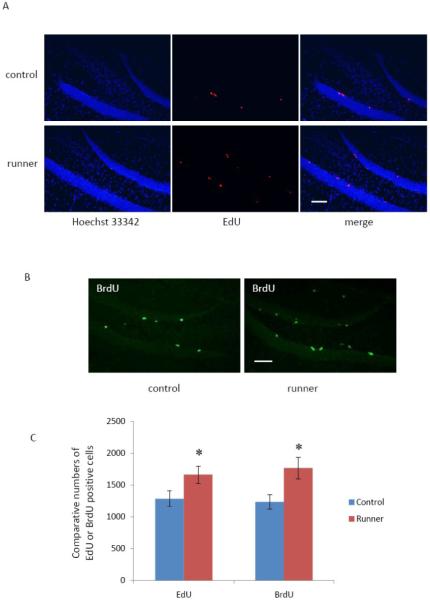
Fig. 3.

Comparison of EdU staining and BrdU staining. Two groups (n = 6) of mice were injected with EdU (200 mg/kg) or BrdU (243.5 mg/kg). Four hours after injection, brains were processed for EdU or BrdU staining. A: Representative images showing that running mice exhibited more EdU positive cells than control mice. EdU (red), Hoechst 33342 (blue). B: Representative images showing that running mice exhibited more BrdU positive cells than control mice. BrdU (green). C: Quantitative data showing that EdU and BrdU positive cell numbers are comparable. The bars represent mean ± SEM. * p < 0.05 in comparison to the control mouse group is considered significant using a two–way ANOVA. Scale bar = 100 μm.
