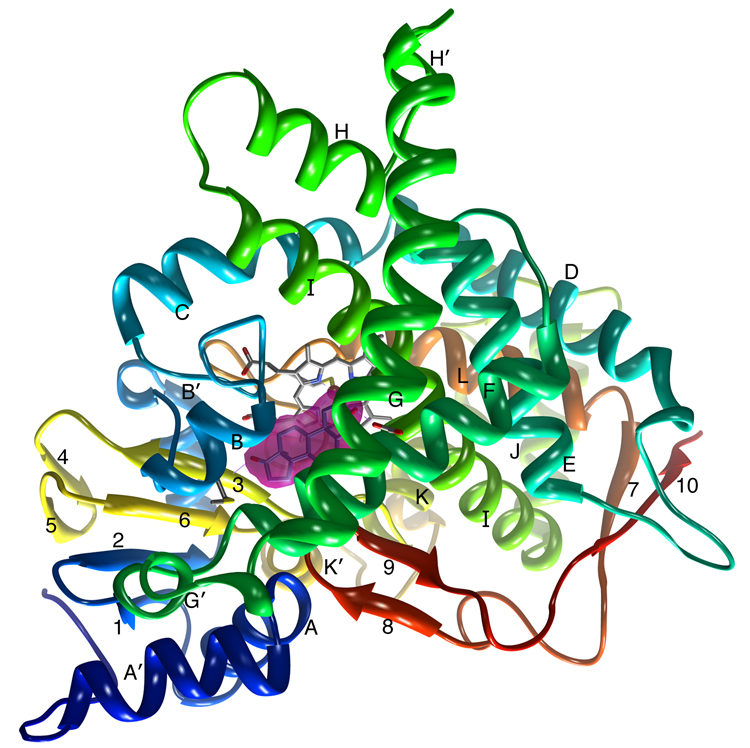
Figure 2.
A ribbon diagram showing the overall structure of human placental aromatase. The amino terminus, starting at residue 45, is colored dark blue and the carboxyl terminus ending at residue 496 is colored red. The α-helices are labeled from A to L and β-strands are numbered from 1 to 10. The heme group and the bound androstenedione molecule at the active site are shown. The bound androstenedione molecule is shown within its unbiased electron density surface contoured in magenta at ~4.5 times the standard deviation. The hydrogen bond-forming interactions at the 3-keto and 17-keto end with Asp309 side chain and Met374 backbone amide, respectively, are also indicated. All 3D illustrations are prepared with Chimera [35].

