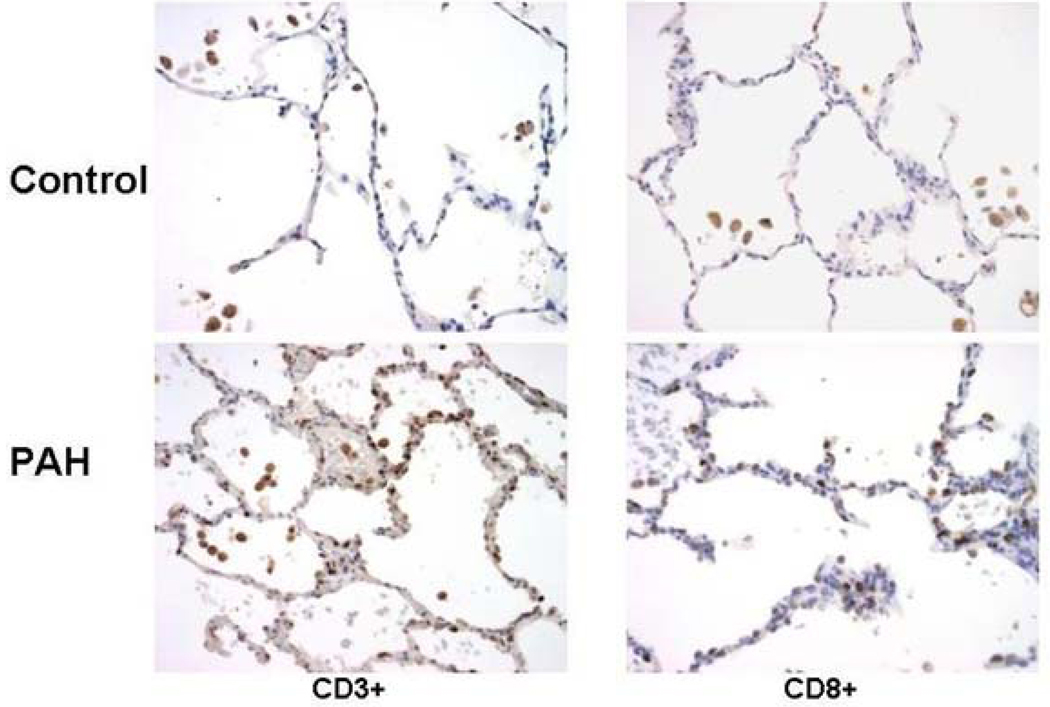
Figure 3. Elevated CD3+ and CD8+ lymphocytes in the peripheral lung of patients with PAH compared to controls.
(A) Counts of lymphocyte subsets related to total number of nuclei per field in the peripheral lung of PAH patients (grey blocks) and controls (open blocks). Box plots demonstrate the median value (line), and inter-quartile range for each group; * p<0.01 compared to controls. (B) Peripheral lung from a patient with PAH and a control showing increased numbers of CD3+ and CD8+ lymphocytes in the PAH patient. Line in lower right micrograph = 100 µm.


