Abstract
Muscle is one of the tissues located in close proximity to cartilage tissue. Although it has been suggested that muscle could influence skeletal development through generating mechanical forces by means of contraction, very little is known regarding whether muscle cells release biochemical signals to regulate cartilage gene expression. We tested the hypothesis that muscle cells directly regulate cartilage matrix production by analyzing chondrocytes co-cultured with muscle cells in 2D or 3D conditions. We found that chondrocytes cultured with C2C12 muscle cells exhibited enhanced alcian blue staining and elevated expression of collagen II and collagen IX proteins. While non-muscle cells do not promote cartilage matrix production, converting them into muscle cells enhanced their pro-chondrogenic activity. Furthermore, muscle cell-conditioned medium led to increased cartilage matrix production, suggesting that muscle cells secrete pro-chondrogenic factors. Taken together, our study suggests that muscle cells may play an important role in regulating cartilage gene expression. This result may ultimately lead to the discovery of novel factors that regulate cartilage formation and homeostasis, and provide insights into improving the strategies for regenerating cartilage.
Keywords: chondrocytes, matrix, muscle
INTRODUCTION
Most of the bones in the human body are formed through the process of endochondral ossification, where the initially formed cartilage serves as a template for bone formation 1,2. Cartilage tissue consists of extracellular matrix (ECM) and the chondrocytes that secrete the matrix 3. Cartilage ECM is composed mostly of proteoglycans and collagen fibers. In cartilage ECM, proteoglycans such as aggrecan and versican, are bound to large quantities of glycosaminoglycans (GAG), which are highly negatively charged and thus allow cartilage to be resistant to compression 3. The other indispensable component of cartilage ECM is collagen, which provides cartilage with the property of resisting tension. The major collagen in hyaline cartilage is collagen II, whose helical structure is stabilized by other important collagens such as collagen IX and collagen XI 4. Deficiency of these collagens could lead to congenital skeletal disorders such as hypochondrogenesis as well as early onset of arthritis 4–7.
Cartilage matrix production is controlled by many factors including growth hormone, Parathyroid hormone related peptides (PTHrP), Fibroblast growth factors (FGFs) and TGFβ family members (including BMP) 1. These signals are either provided to the cartilage systemically (such as growth hormone), or supplied locally by both the tissues surrounding the developing cartilage and the chondrocytes themselves.
Muscle is a tissue that lies immediately next to the developing cartilage tissue in the embryo and remains in close proximity to the cartilage template after birth 8,9. Multiple pieces of evidence indicate that muscle regulates skeletal development. For example, when muscle was paralyzed by botulinum toxin, which abolished muscle contraction, the chicken embryo showed abnormal joint formation and shortened bones 10. Mouse mutants that lack muscle-specific proteins such as dystrophin/utrophin or myogenin also exhibited skeletal abnormalities such as a curved spine or a reduced size of the skeleton 11–13. Consistent with the phenotype of these mouse mutants, short stature and scoliosis are common features of children with Duchenne Muscular Dystrophy 14,15. Despite these studies, it is still not clear if muscle cells directly influence cartilage matrix production, which may be the underlying mechanism of muscle-mediated skeletal regulation. Our hypothesis is that muscle cells play an important role in regulating cartilage matrix production thereby influencing skeletal structures. We tested this hypothesis by co-culturing chondrocytes with muscle cells and showed that muscle cells provide biochemical signals to enhance cartilage matrix production.
MATERIALS AND METHODS
Cell culture
Murine myoblast (C2C12) and murine mesenchymal (NIH-3T3) cell lines were purchased from ATCC (American Type Culture Collection). Chicken embryonic fibroblasts (CEF) and rat chondrosarcoma (RCS) cells were gifts courtesy of Andrew Lassar (Harvard Medical School). Bovine fetlock joint were obtained from Research 87, Inc.: http://www.research87.com/home.nxg, which supplies cadaver tissues to research institutions. Bovine articular chondrocytes were then isolated from the articular surface of the joints as previously described 16. Briefly, cartilage pieces were digested with 1 mg/ml bovine hyaluronidase (Sigma) for 15 min followed by 30 min of 0.25% trypsin (Sigma) digestion, and finally 15 hrs of 2mg/ml collagenase (Sigma) digestion. Single cell suspension was obtained by passing the cells through a 40 μm cell strainer (BD Biosciences). For monolayer cultures, cells were seeded at a density of 5 × 10⁵/well of a 24 well plate. For 3D collagen gel cultures, cells were seeded at a density of 5 × 10⁵/collagen gel. Collagen gels were composed of 30% rat-tail collagen I (BD biosciences) and 1× DMEM (Invitrogen) 17. A total of 50 μl of collagen gel mixture was used for each 3D construct. All co-cultures were seeded at a ratio of 2:1 (RCS:C2C12). Cells were cultured in DMEM with 10% FBS (Hyclone) and 1% pen/strep. DiI-labeling was performed according to the manufacture’s protocol. Briefly, C2C12 cells were incubated with 1μM DiI (Invitrogen) for 5 min at 37°C, followed by 15 min at 4°C. Afterwards, cells were washed repeatedly with PBS and cultured in fresh medium.
Conditioned media preparation
C2C12 muscle cells were cultured at a confluency of 60–90%. The conditioned medium was collected and filtered using a 0.22 μM filter (Millipore) and applied immediately to chondrocyte cultures. For collecting conditioned medium from CEFs, the cells were infected with avian-retrovirus RCAS-GFP and RCAS-MyoD (constructs from Andrew Lassar, Harvard Medical School). These viruses were generated according to the standard protocol 18, and titered by directly visualizing GFP expression (in the case of RCAS-GFP) or indirect immunocytochemistry using anti-MyoD antibody (in the case of RCAS-MyoD). Viruses with titers of at least 108 particles/ml were applied to CEFs at a concentration of 3 ul/500 ul culture. After 3 days of virus infection, the conditioned media were collected and filtered for subsequent use.
RT-PCR analysis
RNA was isolated from cell cultures using the RNeasy mini kit from Qiagen 19. All PCR analyses were normalized based on GAPDH expression using the iQ5 Real Time PCR Detection System (BioRad). Primer sequences are (all are listed from 5′ to 3′): rat GAPDH (NCBI accession number X02231), 1131-GTTGCTGAGGAGTCCCCA-1147 (Forw) and 1258-CCTATTCGAGAGAAGGGA-1241 (Rev); rat Col IIa (NCBI accession number NM_012929.2), 1972-AAGCAAGGTGACCAGGGTATTCCT-1995 (Forw) and 2255-TTCTCGCCAACATCACCTCTGTCT-2232 (Rev); rat Col IX (NCBI accession number NP_001102145), 1961-TCGTGGATGTGGTGCTGAAGATGA-1984 (Forw) and 2100 -ATTGGGTCCCTGTTTGCCTGGATA-2083 (Rev); rat aggrecan (NCBI accession number NM_0221190.1), 1363-AAGGACTGTCTATCTGCACGCCAA-1386 (Forw) and 1487-TCACCACCCACTCCGAAGAAGTTT-1465 (Rev).
Histological analysis
Cultures were fixed with 4% paraformaldehyde, and then stained with hematoxylin and eosin (H&E) according to standard protocol. For alcian blue staining, cells were incubated with 1% (w/v) alcian blue overnight, followed by repeated washes with 0.1N HCl. Quantification of alcian blue staining was carried out by applying 4M guanidinium chloride to the stained cells then measuring the absorbance of the resultant solution at 590nm on a spectrophotometer 20.
Immunocytochemistry
Cultures were fixed with 4% paraformaldehyde and incubated with primary antibodies overnight. The primary antibodies used in this study are mouse anti-Collagen II (generous gift from Dr. Tom Linsenmayer, Tufts University), MyoD (clone 5.8, Novocastra Laboratories Ltd.), Collagen IX (generous gift from Dr. Tom Linsenmayer, Tufts University), Myosin Heavy Chain (MHC) (MF20 from Dev.Stud.Hyb.Bank) 21 and rabbit anti-Desmin (Abcam Cat#12500). After washing with PBS with 0.1% Tween (PBST), cultures were incubated with secondary antibodies (conjugated with Alexa 488 (green) or 594 (red) from Invitrogen), followed by repeated washing. For detecting actin structures, Alexa Fluor 594-conjugated phalloidin (Invitrogen) was applied to the fixed cells at 5 units/ml for 30 min at room temperature. All cultures were counterstained with DAPI (Invitrogen).
Microscopy
Bright field and fluorescent images from histological and immunocytochemistry analysis of 2D and 3D cultures were taken under the Olympus IX71 inverted microscope using Olympus DP70 digital camera and associated software. For quantification of immunofluorescent signals in 3D cultures, images were taken under the Zeiss LSM510 confocal microscope. For scanning electron microscopy analysis, 3D collagen gel culture specimens were fixed in 1% glutaraldehyde in 0.1 M sodium cacodylate buffer, pH 7.4 for 4 h and stored in buffer overnight. The samples were then post-fixed in 1% osmium tetroxide for 1 h, washed, dehydrated in ethanol, and critically point dried using an Edwards Auto 306 Vacuum Evaporator equipped for general coating. The samples were sputter coated with palladium–gold and observed using an ISI DS130 scanning electron microscope at Tufts Imaging Facility.
Quantification of fluorescent images and statistical analysis
Relative protein levels were quantified by analyzing pixel intensity of the fluorescent images using the computer program Image J 22,23. Values of pixel intensity were normalized to the total chondrocyte numbers, which was determined by their round cell morphology and Collagen II protein expression. Three repeats were carried out for each experiment, and for each experiment 3–10 views of fields were photographed for quantification. For statistical analysis, the mean and standard deviation were calculated. Statistically significant differences (i.e. P<0.05) were determined by one-factor ANOVA with post-hoc Tukey test using the statistics software SYSTAT12 (Systat).
Western Blot analysis
For Western Blot analysis, total protein lysates were obtained following a standard protocol from confluent 6cm tissue culture plates that contained roughly 3×10⁶ cells 24. The proteins were separated by SDS-PAGE using BioRad mini-gel apparatus and blotted onto nitrocellulose membranes using BioRad transfer apparatus. The membranes were blotted with the following antibodies overnight: rabbit anti-Collagen II (Abcam, Ab34712), rabbit anti-Desmin (Abcam, Ab12500) and mouse anti-GAPDH (Abcam, Ab8245). After repeated washing, the membranes were hybridized with secondary antibodies of goat anti-mouse or goat anti-rabbit HRP conjugated antibodies (Calbiochem). The signals were developed using Pierce ECL substrate (cat# 32106), and Kodak films exposed to chemiluminescent signals were developed in Kodak M35A X-OMAT processor.
RESULTS
Muscle cells promote cartilage gene expression in RCS chondrocyte cell line in 2D co-cultures
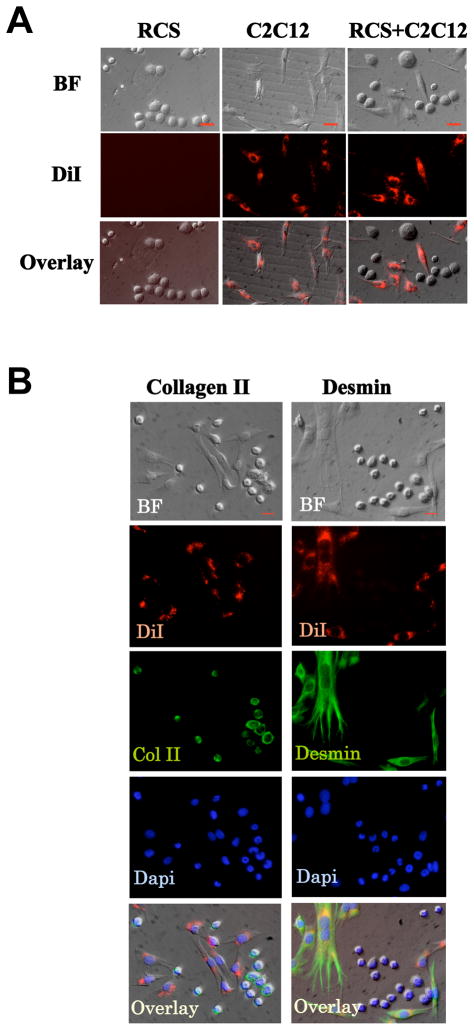
We evaluated the effect of muscle cells on cartilage cells by co-culturing these two cell types as monolayer cultures. For muscle cells, we selected C2C12 (mouse muscle cells), the most widely used muscle cell line in studying muscle differentiation and in muscle tissue engineering 25–27. For cartilage cells, we selected RCS (rat chondrosarcoma cells), which has the same culture condition as C2C12 cells (DMEM with 10% FBS); and is a commonly used cell line for studying cartilage homeostasis, cell cycle control and cartilage matrix gene expression 28–36. We chose muscle and cartilage cells of mouse and rat origins respectively, as the mouse and rat species are closely related but also different which would allow us to perform RT-PCR analysis on only chondrocyte gene expression using rat-specific primers. To confirm that chondrocytes and muscle cells maintain their phenotypes when co-cultured, we labeled C2C12 cells, but not RCS chondrocytes, with lineage tracer DiI. When cultured separately, these two cells types exhibit a distinct difference in cell shape. C2C12 muscle cell have an elongated, fibroblast-like morphology, while RCS chondrocytes are rounded in shape (Fig. 1A). When co-cultured, DiI-positive cells still have the fibroblast-like morphology, while all unlabeled cells maintain a round morphology. This indicates that muscle cells and chondrocytes do not change their morphology upon co-culturing (Fig. 1A). Furthermore, our immunocytochemistry analysis showed that in co-cultures, all RCS cells continued to express cartilage marker Collagen II 28. Similarly, all C2C12 cells continued to express muscle marker Desmin 37 (Fig. 1B). While some muscle cells are at the mononuclear myoblast stages, other muscle cells have fused into myotubes (Fig. 1B). The presence of both cartilage and muscle markers suggests that these two different cell lines maintained their cartilage and muscle phenotype respectively when co-cultured (Fig. 1A and 1B).
Fig. 1. RCS chondrocytes and C2C12 muscle cells maintain their phenotypes in 2D co-cultures.
A. C2C12 cells were labeled with DiI (red), and exhibit elongated morphology in co-cultures. RCS cells were unlabeled, and are round-shaped. BF, bright field. After co-culturing for 2 days, both cell types maintained their cell morphology. Scale bars, 20μm. B. In co-cultures, all RCS chondrocytes continue to express Collagen II (cartilage marker, green), while DiI-labeled C2C12 muscle cells continue to express Desmin (muscle marker, green). The specificity of the antibodies were confirmed by staining with secondary antibodies alone (See Supplemental Fig. 2). BF, bright field. Dapi, nucleus staining. Overlay, merged images of Collagen II, Desmin, Dapi and Bright field. Scale bars, 20μm.
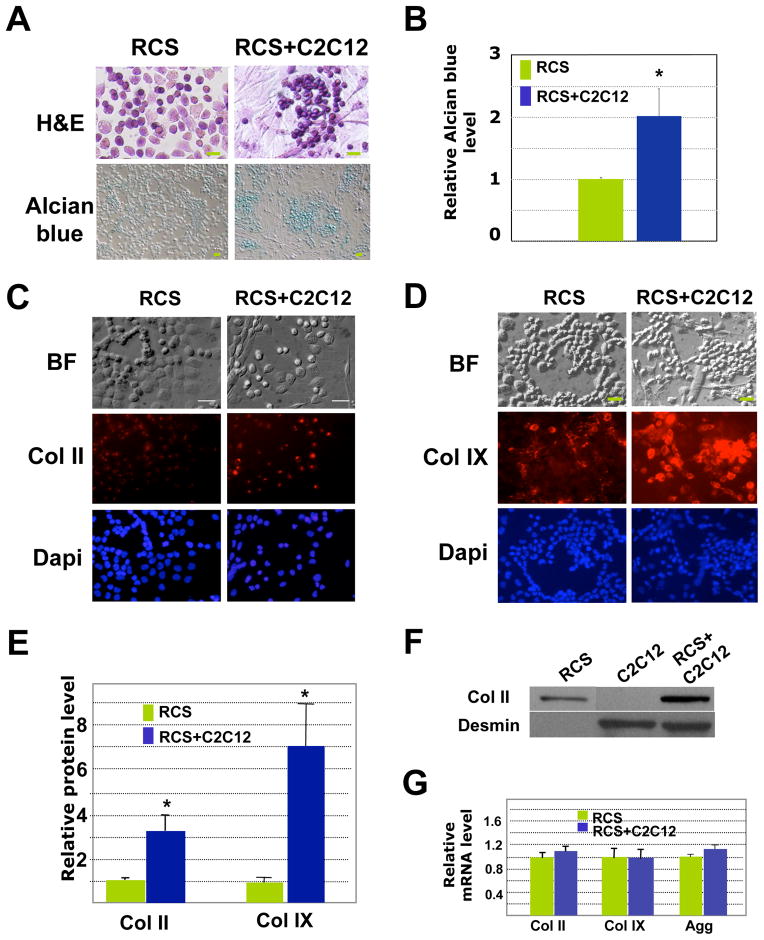
We further evaluated cartilage matrix production through histological and immunocytochemistry analysis. We found that when compared with RCS chondrocytes cultured alone, chondrocytes co-cultured with muscle cells exhibited stronger basophilic H&E staining and more intense alcian blue staining (Fig 2A and 2B), suggestive of the presence of more glycosaminoglycans (which are negatively charged) in co-cultures 3. As we established that muscle cells maintain their muscle identity when co-cultured (Fig 1B), we believe that the increase in alican blue intensity in the co-culture is due to increased amount of cartilage matrix produced by the chondrocytes. It seems that upon co-culturing, muscle cells herd the chondrocytes into clusters and the chondrocytes assume a rounder phenotype (Fig. 2A and 2B). Furthermore, chondrocytes (RCS) co-cultured with mouse C2C12 muscle cells expressed higher levels of collagen II and collagen IX proteins (Fig. 2C-2E). To confirm our quantification result from immunofluorescent signals, we performed Western Blot analysis to evaluate Collagen II protein expression in RCS chondrocytes cultured alone or co-cultured with mouse muscle cells. We again found that RCS chondrocytes co-cultured with C2C12 cells expressed a higher level of Collagen II (Fig. 2F). Interestingly, qRT-PCR analysis indicated that the mRNA levels of cartilage-specific genes (Collagen II, Collagen IX and Aggrecan) were not significantly altered by the presence of muscle cells (Fig. 2F), suggesting that in our 2D cultures, muscle cells promote cartilage matrix production primarily at the post-transcriptional level.
Fig. 2. C2C12 muscle cells enhance cartilage matrix production in RCS cells in 2D co-cultures.
A. H&E and alcian blue staining after 4 days of culture. Co-cultured chondrocytes showed stronger basophilic staining than chondrocytes cultured alone. No alcian blue staining was observed for C2C12 muscle cells cultured alone (data not shown). Scale bars, 20μm. B. Alcian blue quantification. Values shown are the absorbance values at 590nm when dissolved in 4M GuCl after being normalized to the total chondrocyte number. C. Immunocytochemistry analysis of Col II (red). For a negative IgG control, see S-Fig. 2A. BF, Bright field. D. Immunocytochemistry analysis of Col IX (red). BF, Bright field. For a negative IgG control, see S-Fig. 2A. E. Quantification of relative Col II and Col IX protein level based on immunofluorescent intensities (pixels) using the program “Image J”. Values are normalized to total chondrocyte number. * indicates: P<0.05 in statistical analysis (n=4). F. Western Blot analysis on cell lysates obtained from RCS cultures, C2C12 cultures, and RCS and C2C12 co-cultures. As we were unable to locate an antibody that reacts specifically to rat GAPDH, but not mouse GAPDH, we normalized the protein loading to the number of RCS chondrocytes. Desmin, a muscle-specific protein, in only present in lysates of C2C12 cells. G. qRT-PCR analysis of Col II, Col IX and Aggrecan mRNA levels. Green, RCS alone; Blue, RCS-C2C12 co-cultures.
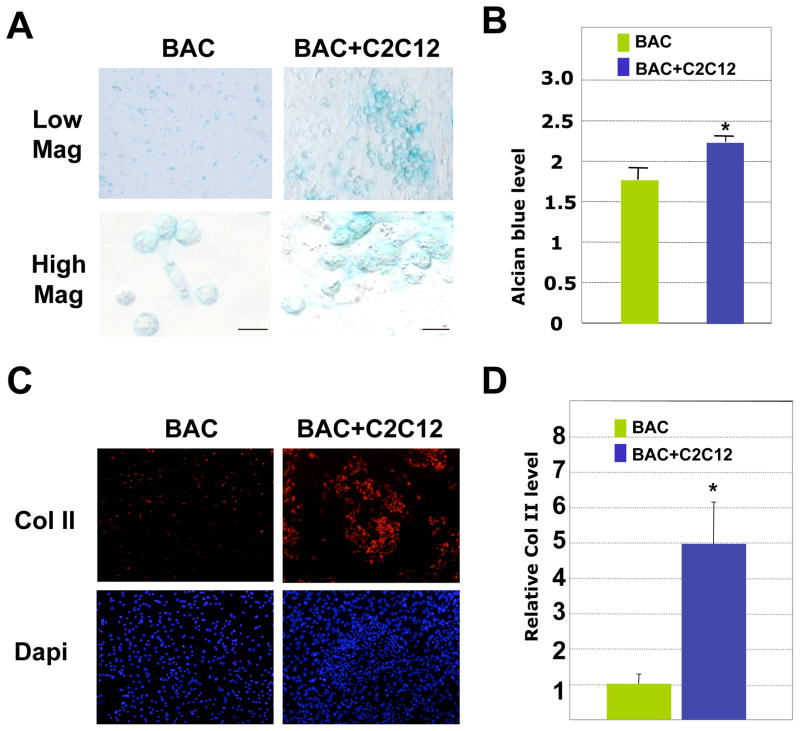
To evaluate whether muscle cells also have the same effect on primary chondrocytes, we cultured primary bovine articular chondrocytes (BAC) with C2C12 muscle cells. We found that co-cultured primary chondrocytes also exhibited stronger alcian blue staining and collagen II staining than those of chondrocytes cultured alone (Fig. 3A–D). Taken together, our results demonstrate that C2C12 muscle cells increase the expression of cartilage matrix proteins in a chondrocyte cell line as well as in primary chondrocytes.
Fig. 3. C2C12 muscle cells promote cartilage matrix production in primary bovine articular chondrocytes (BAC) in 2D cultures.
A. Alcian blue staining after 4 days of culturing. Low mag (low magnification), 10X; high mag (high magnification, 40X). Some BAC cells had a de-differentiated morphology when cultured alone. Scale bars, 20μm. B. Quantification of alcian blue staining from 3 culture replicates. Values shown are the absorbance values at 590nm when dissolved in 4M GuCl. * denotes: P<0.05 in statistical analysis. C. Immunocytochemistry analysis of Collagen II staining (red). Muscle cells are not positive for Col II. D. Quantification of relative Collagen II protein level, using Image J. The values are fluorescent signal intensities of the entire microscopic views of BAC and BAC+C2C12 cells, and not normalized to total numbers of chondrocytes. * denotes: P<0.05 in statistical analysis (n=4).
Non-muscle cells do not promote cartilage matrix production in RCS chondrocytes
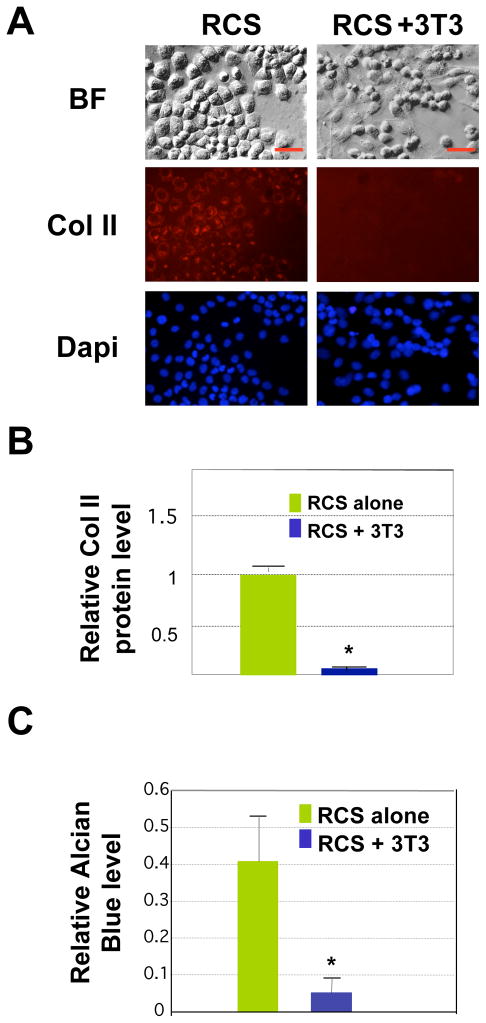
We then asked whether the effect on cartilage gene expression is specific to muscle cells or if other cell types could also promote matrix production when co-cultured with chondrocytes. Thus we co-cultured RCS chondrocytes with the non-muscle mesenchymal cell line NIH3T3. We found that NIH3T3 also herded the chondrocytes into clusters, similar to the way C2C12 muscle cells herd the chondrocytes in co-cultures (Fig. 4A). Compared with RCS chondrocytes cultured alone, chondrocytes co-cultured with NIH3T3 did not exhibit increased Collagen II expression after 4 days of culturing (Fig. 4A and 4B). Furthermore, chondrocyte-NIH 3T3 co-cultures exhibited a much lower level of alcian blue staining compared with chondrocytes cultured alone (Fig. 4C). This result indicates that non-muscle cells NIH3T3 do not promote cartilage matrix production in RCS chondrocytes. This result also suggests that confinement of chondrocytes into a smaller growth space, a process that benefits chondrocyte differentiation from progenitor cells 38, is not sufficient to promote cartilage matrix production in already-formed chondrocytes.
Fig. 4. Non-muscle NIH3T3 cells do not promote cartilage matrix production in 2D cultures.
A. Collagen II immunostaining (red) after co-culturing RCS chondrocytes with NIH3T3 cells for 4 days. Scale bars, 20μm. B. Quantification of Col II fluorescent intensity using the program Image J. Values are normalized to total number of chondrocytes.. * denotes: P<0.05 in statistical analysis (n=4). C. Quantification of alcian blue staining from 3 culture replicates. Values shown here are the absolute values of absorbance reading at 590nm when dissolved in 4M GuCl.. * denotes: P<0.05 in statistical analysis.
Muscle cell-secreted factors promote collagen II and collagen IX expression
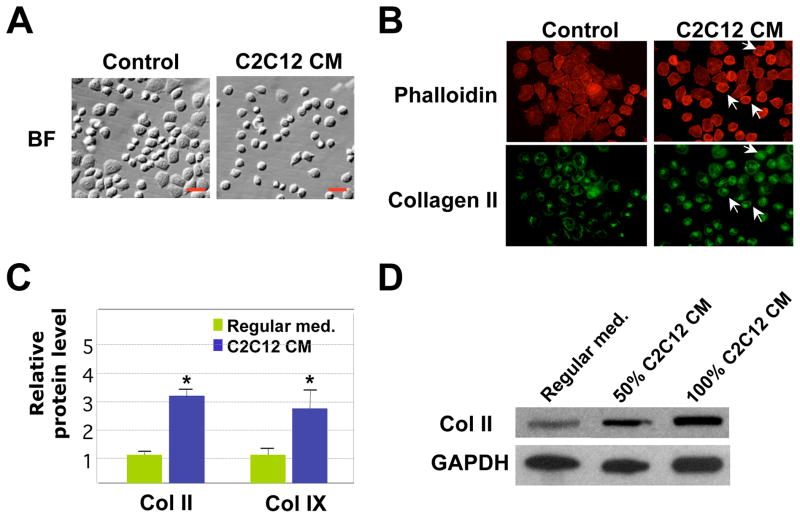
To test if muscle cells promote cartilage matrix production by releasing secreted factors into the medium, we cultured RCS chondrocytes in C2C12 muscle cell-conditioned medium. We noticed that chondrocytes cultured in the conditioned medium of C2C12 muscle cells looked rounder and less flattened than chondrocytes cultured in regular medium (Fig. 5A), similar to what we observed in muscle-cartilage cell co-cultures (see Fig. 2A). This difference in morphology correlates with a change in the actin cytoskeleton, which is reflected by Phalloidin staining (Fig. 5B). It seems that chondrocytes cultured in muscle cell-conditioned medium have a more compact pattern of actin structure. This actin structure is similar to that observed in differentiated primary bovine chondrocytes, but not in de-differentiated chondrocytes (S-Fig. 1). Furthermore, we found that chondrocytes cultured in muscle cell-conditioned medium exhibited a higher level of Collagen II and Collagen IX protein expression in our quantification analysis of the immunofluorescent signals (Fig. 5B and 5C). This result is further confirmed by Western Blot analysis on RCS cells cultured in C2C12 conditioned medium (Fig. 5D). RCS cells cultured in both 50% and 100% C2C12 conditioned medium exhibited a significant increase in Collagen II protein expression as compared with those cultured in the regular medium (Fig. 5D). These results suggest that muscle cells may secrete pro-chondrogenic factors.
Fig. 5. The effect of muscle cell-conditioned medium on chondrocyte cell morphology and cartilage expression in 2D cultures.
A. Bright field (BF) images of RCS chondrocytes cultured in regular medium or C2C12 muscle cell conditioned (CM) medium for 3 days. Cells cultured in C2C12 CM have a more rounded morphology. Scale bars, 20μm. B. Phalloidin (red) and collagen II (green) staining of RCS chondrocytes, indicating a change of cytoskeleton structures upon culturing in muscle cell-conditioned medium. Arrows: cells with rounder morphology. C. Quantification of relative Col II and Col IX protein levels using the program Image J. The intensity values shown here were normalized to total cell numbers. * denotes: P<0.05 in statistical analysis (n=4). D. Western blot analysis on Collagen II protein expression in RCS chondrocytes grown in their culture medium or medium containing 50% and 100% C2C12 conditioned medium. Medium was changed daily. GAPDH, loading control.
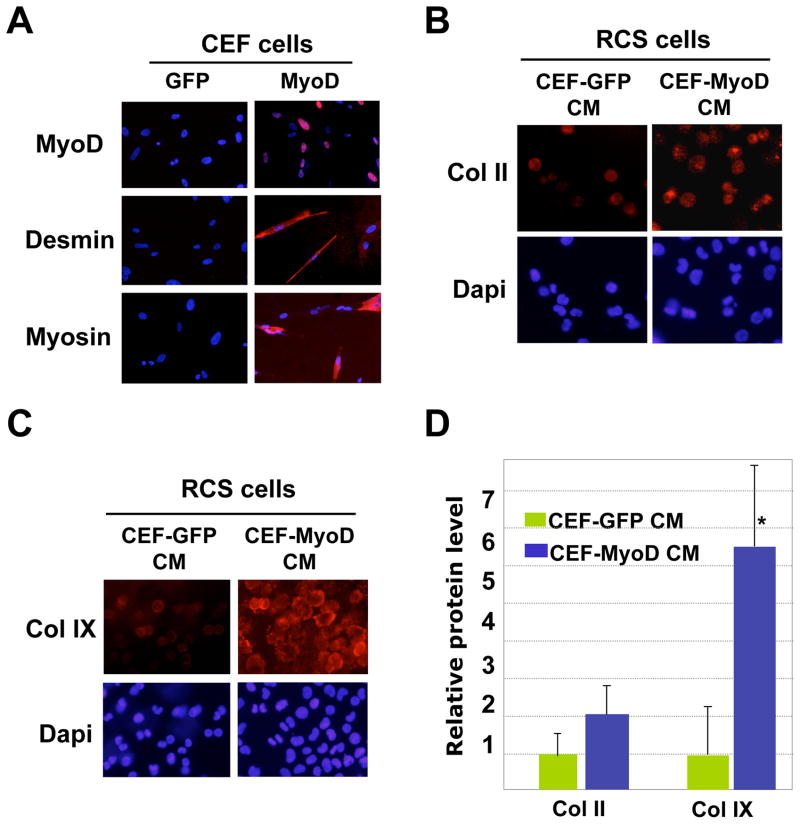
We further confirmed this notion by culturing RCS chondrocytes in the conditioned medium from either a non-muscle cell type or a converted muscle cell type. Primary chick embryo fibroblasts (CEF) are non-muscle cells, and they can be converted into muscle cells when infected with MyoD-expressing viruses. MyoD is a master regulator of myogenesis and can transform many non-muscle cells into muscle cells 39. Indeed, infection of CEF by avian-specific retrovirus RCAS-MyoD induced the expression of muscle-specific markers Desmin and Myosin, while GFP-infected CEFs did not express any of the muscle markers (Fig. 6A). This shows that MyoD infection has converted the CEFs into muscle cells. When we applied CEF-MyoD-conditioned medium to the RCS chondrocytes, we observed a two-fold increase in Collagen II protein expression and a five-fold increase in Collagen IX protein expression as compared with CEFs treated with CEF-GFP control medium (Fig. 6B–6D). Since the avian retroviruses (GFP and MyoD) present in the conditioned medium do not infect rat cells, this result suggests that factors released from converted muscle cells promoted cartilage gene expression.
Fig. 6. Cells converted into muscle cells promote cartilage gene expression.
A. Chicken embryo fibroblasts (CEF) were infected with avian-specific retroviruses GFP (control) and MyoD. Three days after administration of MyoD virus into the medium, many CEFs were positive for MyoD (red), as well as muscle-specific markers Desmin and Myosin (red). Control, GFP virus infection. The muscle marker stainings were overlaid with Dapi staining. B. Immunofluorescent analysis of Col II protein expression in RCS chondrocytes cultured in CEF-GFP and CEF-MyoD conditioned medium (CM) (3 days of culture). C. Analysis of Col IX protein expression by immunostaining in RCS chondrocytes cultured in CEF-GFP or CEF-MyoD conditioned medium (CM) (3 days of culture). D. Quantification of Col II and Col IX protein expression using the program Image J. Values are normalized to total chondrocyte number. * denotes: P<0.05 in statistical analysis (n=4).
Muscle cells promote cartilage matrix production in RCS chondrocytes in 3D co-cultures
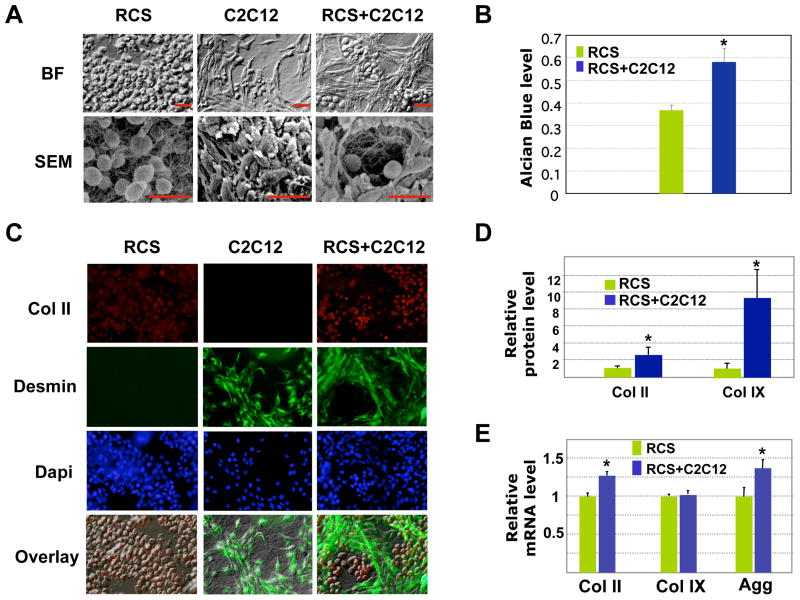
To evaluate the effect of muscle cells on cartilage matrix production in 3D cultures, which recapitulates in vivo situation more accurately, we seeded RCS chondrocytes and C2C12 muscle cells into 3D collagen gels. In collagen gels, RCS chondrocytes exhibited a round morphology when cultured either alone or with muscle cells (Fig. 7A). Strikingly, our bright field and scanning electron microscopic images showed that upon co-culturing, muscle cells formed a 3D lattice-like structure, separating the round chondrocytes into individual compartments (Fig. 7A). Consistent with our 2D analysis, our alcian blue staining on 3D cultures showed enhanced alcian blue staining in co-cultured chondrocytes (Fig. 7B). Our immunocytochemistry analysis confirmed that the cells surrounding the chondrocytes are indeed muscle cells, as they are Desmin-positive (Fig. 7C). In addition, we found that co-cultured chondrocytes had stronger Collagen II and Collagen IX protein expression (Fig. 7D). We further analyzed the mRNA expression of cartilage matrix genes by qRT-PCR. We found that muscle cells enhanced the mRNA expression of Collagen II and Aggrecan (Fig. 7E), while we did not observe such as an effect in our 2D cultures (Fig. 2F). However, in both 2D and 3D cultures, co-culturing with muscle cells did not lead to a significant change in Collagen IX mRNA expression (Fig. 7E). It is possible that 3D culturing may favor the interaction between muscle and cartilage cells, as both cartilage and muscle tissues function in a 3D environment. Nevertheless, both 2D and 3D culture results show that, at the protein level, muscle cells promoted cartilage gene expression in chondrocytes.
Fig. 7. Analysis of RCS chondrocytes and C2C12 muscle cells in 3D collagen gels.
A. Morphological analysis of 3D cultures using light (BF) and scanning electron microscopy (SEM). Scale bars, 20μm. B. Quantification of alcian blue staining with A590nm spectrophotometer reading from 3 culture replicates. Values are normalized to the total chondrocyte number. No alcian blue staining was observed in C2C12 muscle cells cultured alone (data not shown). * denotes: P<0.05 in statistical analysis. C. Immunocytochemistry analysis of collagen II (red) and Desmin (green) expression. D. Quantification of Col II and Col IX protein levels in 3D cultures using the program Image J. The fluorescent intensities from confocal images are normalized to total chondrocyte number. * denotes: P<0.05 in statistical analysis (n=6). E. qRT-PCR analysis of Col II, Col IX and Aggrecan mRNA levels in 3D cultures. Green, RCS alone; Blue, RCS-C2C12 co-cultures.
DISCUSSION
In this investigation, we tested the hypothesis that muscle cells regulate cartilage gene expression by analyzing chondrocytes co-cultured with muscle cells in 2D and 3D conditions. We showed that chondrocytes cultured with muscle cells exhibited enhanced alcian blue staining, which is indicative of increased GAG content 3. In addition, chondrocytes co-cultured with muscle cells showed elevated expression of collagen II and collagen IX proteins. We propose that muscle cells achieve this effect through secreted factors as muscle cell-conditioned medium also led to increased cartilage matrix production.
Muscle regulation of cartilage development
It has long been suggested that muscle could influence skeletal development through mechanical forces generated by muscle contraction 10,40. Support for this notion stems from earlier experiments in which muscle movement was abolished either by neurotoxin or extraction of amniotic fluid, leading to reduced skeleton size or abnormal joint structures 10,41. Thus these authors suggest that the altered mechanical stimuli can be sensed by the developing cartilage. However, it is not clear how these treatments had altered cartilage matrix gene expression. Consistent with this theory, in vitro stress testings indeed show that mechanical forces can directly affect cartilage development 42,43.
Our results suggest that muscle may also influence skeletal development by releasing biochemical signals outside the muscle cells. Indeed, muscle secretes a variety of growth factors or cytokines that can be carried away by blood or interstitial fluid 44–47. Among them is the known pro-chondrogenic factor IGF-I 43,46. In our experiments, we did not specifically select muscle cells of different stages (myoblast and myocyte or myotube), which have different gene expression profiles 45,48. It is not clear whether IGF-I or other unknown factors are responsible for muscle cell-mediated cartilage regulation in our experimental settings. Our work is consistent with the study which showed that mouse muscle-derived stem cells were co-cultured with human nucleus pulposus cells, proteoglycan expression of the nucleus pulposus cells were increased 49. The fact that muscle cells secrete pro-chondrogenic factors is also consistent with the results from studying muscle-specific gene knockouts and muscle paralysis models. While knocking out muscle-specific genes would affect the profile of muscle secreted factors 11,13, muscle paralysis would inevitably lead to muscle atrophy and myocyte cell death 50, thereby also leading to altered muscle cell-derived biochemical signals.
Differential control of mRNA and protein expression in chondrocytes
The expression of cartilage ECM can be regulated at both the mRNA level and the protein level. It is known that cartilage gene expression is regulated by many factors at the transcriptional level. Transcription factors such as Sox9 family members, Nkx3.2, Groucho, PGC1a, Delta-EF1 or AP2, all control the transcription of cartilage matrix genes 17,28,51–54. We have found that muscle cells strongly promote cartilage matrix production at the protein level. It is possible that muscle cells regulate cartilage ECM at the level of translational control, or at the level of matrix degradation and maintenance. Thus it will be intriguing to investigate whether muscle cells affect the expression of cartilage degradation enzymes (such as MMPs and ADAMTs) or MMP inhibitors, Timps 55–57. Future studies will focus on the mechanism by which muscle cells regulate cartilage gene expression. Identification of novel factors and regulatory pathways will undoubtedly have a positive impact on the understanding of skeletal diseases and the technology of cartilage regeneration.
Supplementary Material
Acknowledgments
We are grateful to Dr. David Kaplan (Tufts) for helpful discussions. We thank Drs. Andrew Lassar (Harvard) and Tom Linsenmayer (Tufts) for providing reagents and antibodies. We thank Cathy Linsenmayer, Derrick Hwu and Anthony Bartley for their excellent technical help. This work has been supported by grants to LZ from the Arthritis National Research Foundation and from the NIH (AR054611).
References
- 1.Kronenberg HM. Developmental regulation of the growth plate. Nature. 2003;423(6937):332–6. doi: 10.1038/nature01657. [DOI] [PubMed] [Google Scholar]
- 2.Sandell LJ, Adler P. Developmental patterns of cartilage. Front Biosci. 1999;4:D731–42. doi: 10.2741/sandell. [DOI] [PubMed] [Google Scholar]
- 3.Hall BK, editor. Cartilage. 1. Vol. 2. New York: Academic Press; 1983. p. 409. [Google Scholar]
- 4.Blaschke UK, Eikenberry EF, Hulmes DJ, Galla HJ, Bruckner P. Collagen XI nucleates self-assembly and limits lateral growth of cartilage fibrils. J Biol Chem. 2000;275(14):10370–8. doi: 10.1074/jbc.275.14.10370. [DOI] [PubMed] [Google Scholar]
- 5.Freisinger P, Bonaventure J, Stoess H, Pontz BF, Emmrich P, Nerlich A. Type II collagenopathies: are there additional family members? Am J Med Genet. 1996;63(1):137–43. doi: 10.1002/(SICI)1096-8628(19960503)63:1<137::AID-AJMG24>3.0.CO;2-O. [DOI] [PubMed] [Google Scholar]
- 6.Freisinger P, Ala-Kokko L, LeGuellec D, Franc S, Bouvier R, Ritvaniemi P, Prockop DJ, Bonaventure J. Mutation in the COL2A1 gene in a patient with hypochondrogenesis. Expression of mutated COL2A1 gene is accompanied by expression of genes for type I procollagen in chondrocytes. J Biol Chem. 1994;269(18):13663–9. [PubMed] [Google Scholar]
- 7.Lefkoe TP, Nalin AM, Clark JM, Reife RA, Sugai J, Sandell LJ. Gene expression of collagen types IIA and IX correlates with ultrastructural events in early osteoarthrosis: new applications of the rabbit meniscectomy model. J Rheumatol. 1997;24(6):1155–63. [PubMed] [Google Scholar]
- 8.Buckingham M, Bajard L, Chang T, Daubas P, Hadchouel J, Meilhac S, Montarras D, Rocancourt D, Relaix F. The formation of skeletal muscle: from somite to limb. J Anat. 2003;202(1):59–68. doi: 10.1046/j.1469-7580.2003.00139.x. [DOI] [PMC free article] [PubMed] [Google Scholar]
- 9.Stockdale FE, Nikovits W, Jr, Christ B. Molecular and cellular biology of avian somite development. Dev Dyn. 2000;219(3):304–21. doi: 10.1002/1097-0177(2000)9999:9999<::AID-DVDY1057>3.0.CO;2-5. [DOI] [PubMed] [Google Scholar]
- 10.Drachman D, Sokoloff l. The role of movement in embryonic joint development. Dev Biol. 1966;14:401. [Google Scholar]
- 11.Deconinck AE, Rafael JA, Skinner JA, Brown SC, Potter AC, Metzinger L, Watt DJ, Dickson JG, Tinsley JM, Davies KE. Utrophin-dystrophin-deficient mice as a model for Duchenne muscular dystrophy. Cell. 1997;90(4):717–27. doi: 10.1016/s0092-8674(00)80532-2. [DOI] [PubMed] [Google Scholar]
- 12.Knapp JR, Davie JK, Myer A, Meadows E, Olson EN, Klein WH. Loss of myogenin in postnatal life leads to normal skeletal muscle but reduced body size. Development. 2006;133(4):601–10. doi: 10.1242/dev.02249. [DOI] [PubMed] [Google Scholar]
- 13.Meadows E, Cho JH, Flynn JM, Klein WH. Myogenin regulates a distinct genetic program in adult muscle stem cells. Dev Biol. 2008 doi: 10.1016/j.ydbio.2008.07.024. [DOI] [PubMed] [Google Scholar]
- 14.Rapaport D, Colletto GM, Vainzof M, Duaik MC, Zatz M. Short stature in Duchenne muscular dystrophy. Growth Regul. 1991;1(1):11–5. [PubMed] [Google Scholar]
- 15.Eiholzer U, Boltshauser E, Frey D, Molinari L, Zachmann M. Short stature: a common feature in Duchenne muscular dystrophy. Eur J Pediatr. 1988;147(6):602–5. doi: 10.1007/BF00442472. [DOI] [PubMed] [Google Scholar]
- 16.Crawford A, Dickinson SC. Chondrocyte isolation, expansion, and culture on polymer scaffolds. Methods Mol Biol. 2004;238:147–58. doi: 10.1385/1-59259-428-x:147. [DOI] [PubMed] [Google Scholar]
- 17.Cairns DM, Sato ME, Lee PG, Lassar AB, Zeng L. A gradient of Shh establishes mutually repressing somitic cell fates induced by Nkx3.2 and Pax3. Dev Biol. 2008;323(2):152–65. doi: 10.1016/j.ydbio.2008.08.024. [DOI] [PMC free article] [PubMed] [Google Scholar]
- 18.Johnson RL, Laufer E, Riddle RD, Tabin C. Ectopic expression of Sonic hedgehog alters dorsal-ventral patterning of somites. Cell. 1994;79(7):1165–73. doi: 10.1016/0092-8674(94)90008-6. [DOI] [PubMed] [Google Scholar]
- 19.Zeng L, Kempf H, Murtaugh LC, Sato ME, Lassar AB. Shh establishes an Nkx3.2/Sox9 autoregulatory loop that is maintained by BMP signals to induce somitic chondrogenesis. Genes Dev. 2002;16(15):1990–2005. doi: 10.1101/gad.1008002. [DOI] [PMC free article] [PubMed] [Google Scholar]
- 20.Morris JE, Ting YP. Comparison of proteoglycans extracted by saline and guanidinium chloride from cultured chick retinas. J Neurochem. 1981;37(6):1594–602. doi: 10.1111/j.1471-4159.1981.tb06332.x. [DOI] [PubMed] [Google Scholar]
- 21.Bader D, Masaki T, Fischman DA. Immunochemical analysis of myosin heavy chain during avian myogenesis in vivo and in vitro. J Cell Biol. 1982;95(3):763–70. doi: 10.1083/jcb.95.3.763. [DOI] [PMC free article] [PubMed] [Google Scholar]
- 22.Abramoff M, Magelhaes P, Ram S. Image processing with ImageJ. Biophotonics International. 2004;11(7):36–42. [Google Scholar]
- 23.Girish V, Vijayalakshmi A. Affordable image analysis using NIH Image/ImageJ. Indian J Cancer. 2004;41(1):47. [PubMed] [Google Scholar]
- 24.Fagotto F, Jho E, Zeng L, Kurth T, Joos T, Kaufmann C, Costantini F. Domains of axin involved in protein-protein interactions, Wnt pathway inhibition, and intracellular localization. J Cell Biol. 1999;145(4):741–56. doi: 10.1083/jcb.145.4.741. [DOI] [PMC free article] [PubMed] [Google Scholar]
- 25.Boontheekul T, Hill EE, Kong HJ, Mooney DJ. Regulating myoblast phenotype through controlled gel stiffness and degradation. Tissue Eng. 2007;13(7):1431–42. doi: 10.1089/ten.2006.0356. [DOI] [PubMed] [Google Scholar]
- 26.Cimetta E, Flaibani M, Mella M, Serena E, Boldrin L, De Coppi P, Elvassore N. Enhancement of viability of muscle precursor cells on 3D scaffold in a perfusion bioreactor. Int J Artif Organs. 2007;30(5):415–28. doi: 10.1177/039139880703000509. [DOI] [PubMed] [Google Scholar]
- 27.Shansky J, Creswick B, Lee P, Wang X, Vandenburgh H. Paracrine release of insulin-like growth factor 1 from a bioengineered tissue stimulates skeletal muscle growth in vitro. Tissue Eng. 2006;12(7):1833–41. doi: 10.1089/ten.2006.12.1833. [DOI] [PubMed] [Google Scholar]
- 28.Lefebvre V, Smits P. Transcriptional control of chondrocyte fate and differentiation. Birth Defects Res C Embryo Today. 2005;75(3):200–12. doi: 10.1002/bdrc.20048. [DOI] [PubMed] [Google Scholar]
- 29.Akiyama H, Kamitani T, Yang X, Kandyil R, Bridgewater LC, Fellous M, Mori-Akiyama Y, de Crombrugghe B. The transcription factor Sox9 is degraded by the ubiquitin-proteasome system and stabilized by a mutation in a ubiquitin-target site. Matrix Biol. 2005;23(8):499–505. doi: 10.1016/j.matbio.2004.10.002. [DOI] [PubMed] [Google Scholar]
- 30.Issack PS, Liu CJ, Prazak L, Di Cesare PE. A silencer element in the cartilage oligomeric matrix protein gene regulates chondrocyte-specific expression. J Orthop Res. 2004;22(4):751–8. doi: 10.1016/j.orthres.2003.12.006. [DOI] [PubMed] [Google Scholar]
- 31.Hachisuka H, Mochizuki Y, Yasunaga Y, Natsu K, Sharman P, Shinomiya R, Ochi M. Flow cytometric discrimination of mesenchymal progenitor cells from bone marrow-adherent cell populations using CD34/44/45(−) and Sca-1(+) markers. J Orthop Sci. 2007;12(2):161–9. doi: 10.1007/s00776-006-1098-6. [DOI] [PubMed] [Google Scholar]
- 32.Kolupaeva V, Laplantine E, Basilico C. PP2A-mediated dephosphorylation of p107 plays a critical role in chondrocyte cell cycle arrest by FGF. PLoS One. 2008;3(10):e3447. doi: 10.1371/journal.pone.0003447. [DOI] [PMC free article] [PubMed] [Google Scholar]
- 33.Krejci P, Masri B, Fontaine V, Mekikian PB, Weis M, Prats H, Wilcox WR. Interaction of fibroblast growth factor and C-natriuretic peptide signaling in regulation of chondrocyte proliferation and extracellular matrix homeostasis. J Cell Sci. 2005;118(Pt 21):5089–100. doi: 10.1242/jcs.02618. [DOI] [PubMed] [Google Scholar]
- 34.Krejci P, Salazar L, Goodridge HS, Kashiwada TA, Schibler MJ, Jelinkova P, Thompson LM, Wilcox WR. STAT1 and STAT3 do not participate in FGF-mediated growth arrest in chondrocytes. J Cell Sci. 2008;121(Pt 3):272–81. doi: 10.1242/jcs.017160. [DOI] [PubMed] [Google Scholar]
- 35.Priore R, Dailey L, Basilico C. Downregulation of Akt activity contributes to the growth arrest induced by FGF in chondrocytes. J Cell Physiol. 2006;207(3):800–8. doi: 10.1002/jcp.20620. [DOI] [PubMed] [Google Scholar]
- 36.Perkins GL, Derfoul A, Ast A, Hall DJ. An inhibitor of the stretch-activated cation receptor exerts a potent effect on chondrocyte phenotype. Differentiation. 2005;73(5):199–211. doi: 10.1111/j.1432-0436.2005.00024.x. [DOI] [PubMed] [Google Scholar]
- 37.Bar H, Strelkov SV, Sjoberg G, Aebi U, Herrmann H. The biology of desmin filaments: how do mutations affect their structure, assembly, and organisation? J Struct Biol. 2004;148(2):137–52. doi: 10.1016/j.jsb.2004.04.003. [DOI] [PubMed] [Google Scholar]
- 38.Fischer L, Boland G, Tuan RS. Wnt-3A enhances bone morphogenetic protein-2-mediated chondrogenesis of murine C3H10T1/2 mesenchymal cells. J Biol Chem. 2002;277(34):30870–8. doi: 10.1074/jbc.M109330200. [DOI] [PubMed] [Google Scholar]
- 39.Lassar A, Munsterberg A. Wiring diagrams: regulatory circuits and the control of skeletal myogenesis. Curr Opin Cell Biol. 1994;6(3):432–42. doi: 10.1016/0955-0674(94)90037-x. [DOI] [PubMed] [Google Scholar]
- 40.Nowlan N, murphy M, Prendergast PJ. A dynamic pattern of mechanical stiumulation promotes ossification in avian embryonic long bones. J biomech. 2008;41(2):249–58. doi: 10.1016/j.jbiomech.2007.09.031. [DOI] [PubMed] [Google Scholar]
- 41.Palacios J, Rodriguez JI, Ruiz A, Sanchez M, Alvarez I, DeMiguel E. Long bone development in extrinsic fetal akinesia: an experimental study in rat fetuses subjected to oligohydramnios. Teratology. 1992;46(1):79–84. doi: 10.1002/tera.1420460111. [DOI] [PubMed] [Google Scholar]
- 42.Carter DR. Mechanical loading history and skeletal biology. J Biomech. 1987;20(11–12):1095–109. doi: 10.1016/0021-9290(87)90027-3. [DOI] [PubMed] [Google Scholar]
- 43.Kuo CK, Li WJ, Mauck RL, Tuan RS. Cartilage tissue engineering: its potential and uses. Curr Opin Rheumatol. 2006;18(1):64–73. doi: 10.1097/01.bor.0000198005.88568.df. [DOI] [PubMed] [Google Scholar]
- 44.Tomczak KK, Marinescu VD, Ramoni MF, Sanoudou D, Montanaro F, Han M, Kunkel LM, Kohane IS, Beggs AH. Expression profiling and identification of novel genes involved in myogenic differentiation. Faseb J. 2004;18(2):403–5. doi: 10.1096/fj.03-0568fje. [DOI] [PubMed] [Google Scholar]
- 45.Delgado I, Huang X, Jones S, Zhang L, Hatcher R, Gao B, Zhang P. Dynamic gene expression during the onset of myoblast differentiation in vitro. Genomics. 2003;82(2):109–21. doi: 10.1016/s0888-7543(03)00104-6. [DOI] [PubMed] [Google Scholar]
- 46.Harridge SD. Plasticity of human skeletal muscle: gene expression to in vivo function. Exp Physiol. 2007;92(5):783–97. doi: 10.1113/expphysiol.2006.036525. [DOI] [PubMed] [Google Scholar]
- 47.Pedersen BK, Akerstrom TC, Nielsen AR, Fischer CP. Role of myokines in exercise and metabolism. J Appl Physiol. 2007;103(3):1093–8. doi: 10.1152/japplphysiol.00080.2007. [DOI] [PubMed] [Google Scholar]
- 48.Kislinger T, Gramolini AO, Pan Y, Rahman K, MacLennan DH, Emili A. Proteome dynamics during C2C12 myoblast differentiation. Mol Cell Proteomics. 2005;4(7):887–901. doi: 10.1074/mcp.M400182-MCP200. [DOI] [PubMed] [Google Scholar]
- 49.Vadala G, Sobajima S, Lee JY, Huard J, Denaro V, Kang JD, Gilbertson LG. In vitro interaction between muscle-derived stem cells and nucleus pulposus cells. Spine J. 2008;8(5):804–9. doi: 10.1016/j.spinee.2007.07.394. [DOI] [PubMed] [Google Scholar]
- 50.Drachman DB. Atrophy of Skeletal Muscle in Chick Embryos Treated with Botulinum Toxin. Science. 1964;145:719–21. doi: 10.1126/science.145.3633.719. [DOI] [PubMed] [Google Scholar]
- 51.Okazaki K, Sandell LJ. Extracellular matrix gene regulation. Clin Orthop Relat Res. 2004;(427 Suppl):S123–8. doi: 10.1097/01.blo.0000144478.51284.f3. [DOI] [PubMed] [Google Scholar]
- 52.Wang W, Wang YG, Reginato AM, Glotzer DJ, Fukai N, Plotkina S, Karsenty G, Olsen BR. Groucho homologue Grg5 interacts with the transcription factor Runx2-Cbfa1 and modulates its activity during postnatal growth in mice. Dev Biol. 2004;270(2):364–81. doi: 10.1016/j.ydbio.2004.03.003. [DOI] [PubMed] [Google Scholar]
- 53.Kawakami Y, Tsuda M, Takahashi S, Taniguchi N, Esteban CR, Zemmyo M, Furumatsu T, Lotz M, Belmonte JC, Asahara H. Transcriptional coactivator PGC-1alpha regulates chondrogenesis via association with Sox9. Proc Natl Acad Sci U S A. 2005;102(7):2414–9. doi: 10.1073/pnas.0407510102. [DOI] [PMC free article] [PubMed] [Google Scholar]
- 54.Taniguchi N, Yoshida K, Ito T, Tsuda M, Mishima Y, Furumatsu T, Ronfani L, Abeyama K, Kawahara K, Komiya S, et al. Stage-specific secretion of HMGB1 in cartilage regulates endochondral ossification. Mol Cell Biol. 2007;27(16):5650–63. doi: 10.1128/MCB.00130-07. [DOI] [PMC free article] [PubMed] [Google Scholar]
- 55.Burrage PS, Mix KS, Brinckerhoff CE. Matrix metalloproteinases: role in arthritis. Front Biosci. 2006;11:529–43. doi: 10.2741/1817. [DOI] [PubMed] [Google Scholar]
- 56.Burrage PS, Brinckerhoff CE. Molecular targets in osteoarthritis: metalloproteinases and their inhibitors. Curr Drug Targets. 2007;8(2):293–303. doi: 10.2174/138945007779940098. [DOI] [PubMed] [Google Scholar]
- 57.Glasson SS, Askew R, Sheppard B, Carito B, Blanchet T, Ma HL, Flannery CR, Peluso D, Kanki K, Yang Z, Majumdar MK, Morris EA. Deletion of active ADAMTS5 prevents cartilage degradation in a murine model of osteoarthritis. Nature. 2005;434(7033):644–8. doi: 10.1038/nature03369. [DOI] [PubMed] [Google Scholar]
Associated Data
This section collects any data citations, data availability statements, or supplementary materials included in this article.


