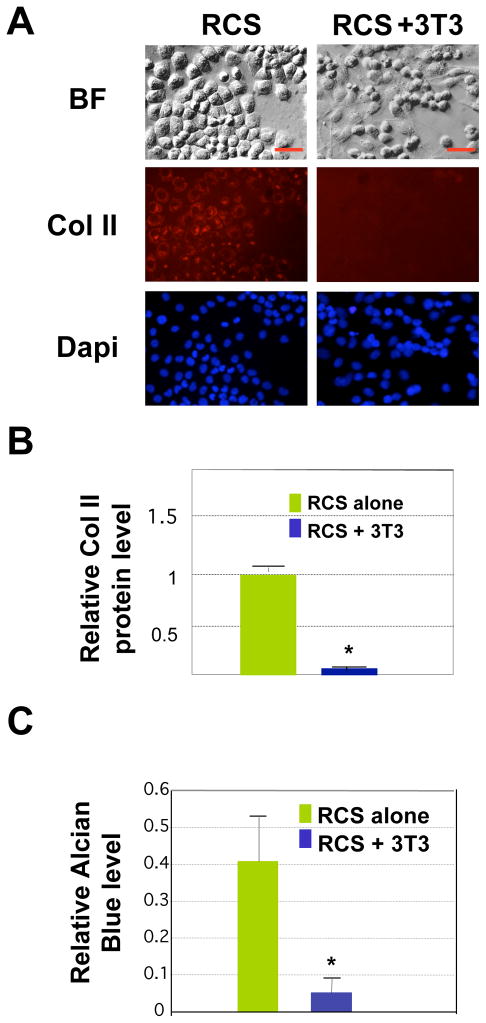
Fig. 4. Non-muscle NIH3T3 cells do not promote cartilage matrix production in 2D cultures.
A. Collagen II immunostaining (red) after co-culturing RCS chondrocytes with NIH3T3 cells for 4 days. Scale bars, 20μm. B. Quantification of Col II fluorescent intensity using the program Image J. Values are normalized to total number of chondrocytes.. * denotes: P<0.05 in statistical analysis (n=4). C. Quantification of alcian blue staining from 3 culture replicates. Values shown here are the absolute values of absorbance reading at 590nm when dissolved in 4M GuCl.. * denotes: P<0.05 in statistical analysis.

