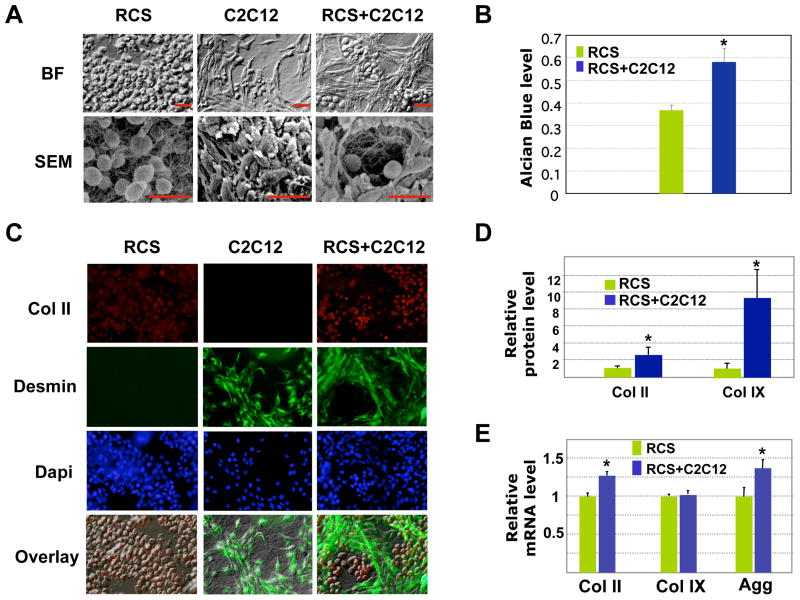
Fig. 7. Analysis of RCS chondrocytes and C2C12 muscle cells in 3D collagen gels.
A. Morphological analysis of 3D cultures using light (BF) and scanning electron microscopy (SEM). Scale bars, 20μm. B. Quantification of alcian blue staining with A590nm spectrophotometer reading from 3 culture replicates. Values are normalized to the total chondrocyte number. No alcian blue staining was observed in C2C12 muscle cells cultured alone (data not shown). * denotes: P<0.05 in statistical analysis. C. Immunocytochemistry analysis of collagen II (red) and Desmin (green) expression. D. Quantification of Col II and Col IX protein levels in 3D cultures using the program Image J. The fluorescent intensities from confocal images are normalized to total chondrocyte number. * denotes: P<0.05 in statistical analysis (n=6). E. qRT-PCR analysis of Col II, Col IX and Aggrecan mRNA levels in 3D cultures. Green, RCS alone; Blue, RCS-C2C12 co-cultures.

