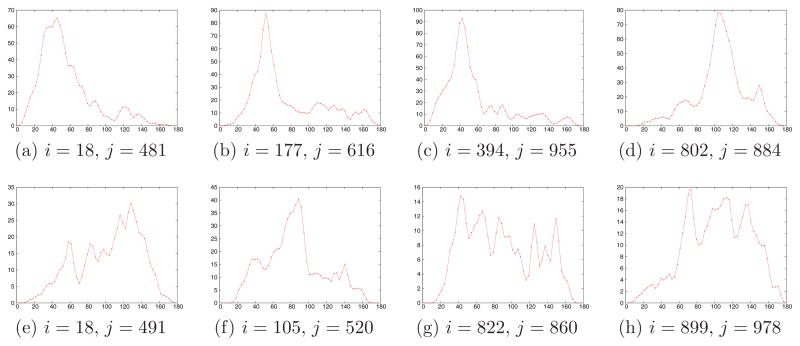
Figure 5.
Smoothed histograms of the angle (in degrees) between pairs of projections. The plots were generated using N = 1000 projections with SNR=1/16. Top row corresponds to pairs of projections whose common lines were correctly identified. Bottom row corresponds to pairs of projections whose common lines were misidentified. Note the different scale of the y-axis in the two cases, indicating much higher peaks for correctly identified common-lines.

