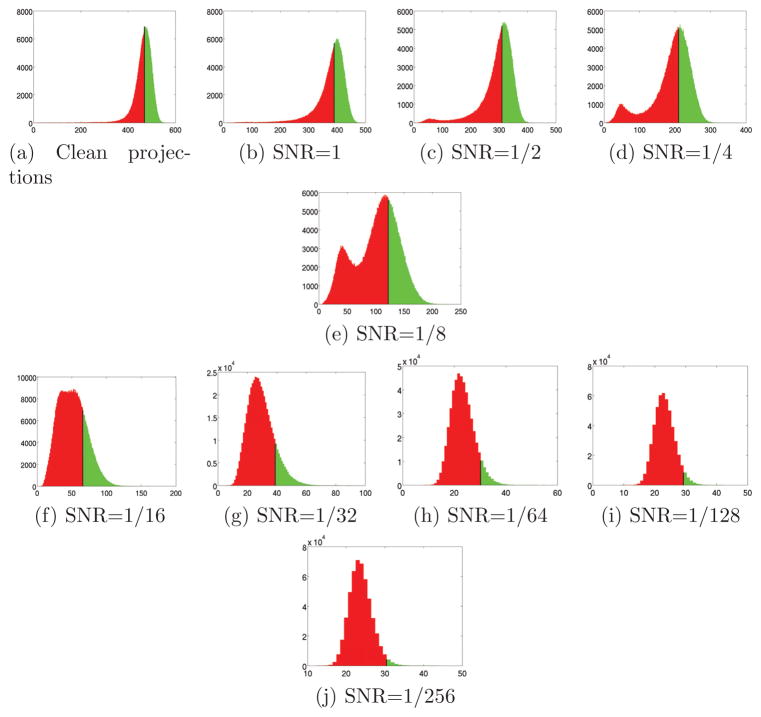
Figure 8.
Histogram of peaks for N = 1000 and various levels of noise. The top p/2 percentile of each histogram is marked in Green, the bottom 1 − p/2 percentile is marked in Red, and the boundary between the regions is marked as a black vertical line. The location of the boundary is the minimal peak height to be considered by the algorithm as a correctly identified common line. Note how this threshold value decreases as the SNR decreases. The algorithm assumes that the correct common lines are concentrated in the Green area and that the wrong common lines are concentrated in the Red area.

