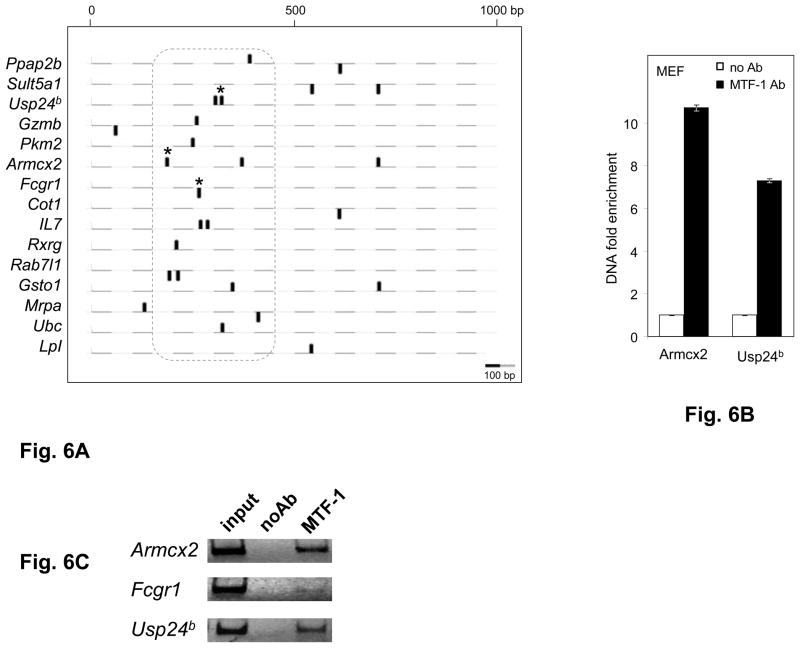
Fig. 6. Downstream MREs are functional in other genes.
A. Positions of MREs predicted in 15 non-selenoprotein genes known as targets of MTF-1. Genomic DNA was analyzed over the region spanning 1000bp downstream from the transcriptional start sites (TSS). Black ovals above and below the dashed lines represent predicted MREs on the plus and minus strand, respectively. Experimentally verified MTF-1 binding sites are marked by asterisks. The dotted line encompasses the MREs located 150–450bp downstream of the TSS. Scale is shown at the lower left. B. MTF-1 binding to predicted MREs in the murine Armcx2, Fcgr1 and Usp24b genes was assessed in MEF cells in the absence of heavy metal treatment. Black bars represent immunoprecipitation with MTF-1 specific antibody (MTF-1 Ab) and white bars represent negative control (normal goat serum), indicated as no Ab. DNA fold enrichment units for immunoprecipitation and no Ab control are normalized against input of total DNA used. Three independent immunoprecipitations were carried out, immunoprecipitated MRE-containing DNA was quantified by real time PCR (n=3) and data are plotted as mean ± SD. C. Gel electrophoresis analysis (4% polyacrylamide -TBE) of the amplification products of a representative PCR reaction.

