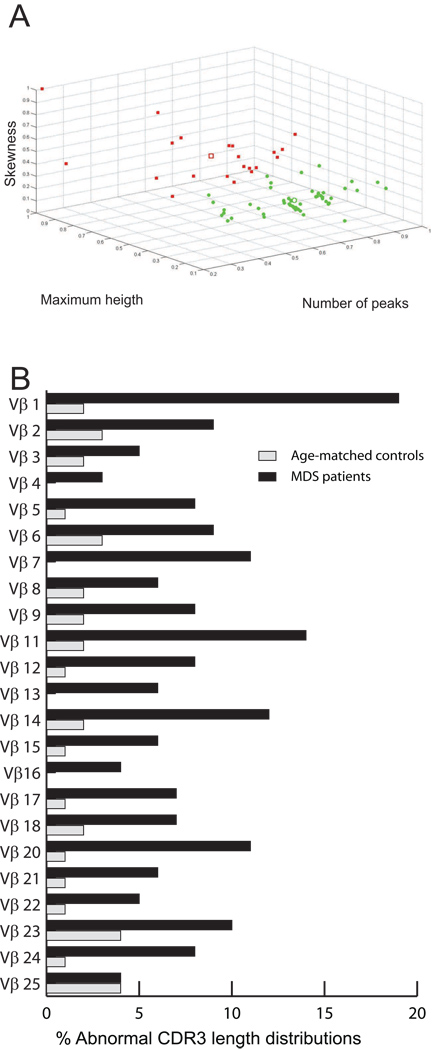
Figure 2. K-means clustering of CDR3 length distributions within Vβ families.
(A) The CDR3 length distributions for Vβ1 from 50 MDS patients and 23 age-matched controls are plotted according to their number of peaks, maximum relative height, and skewness. Two clusters – one characterized by high number of peaks, low maximum relative height, and low skewness (normal), and another with the opposite characteristics (abnormal) – are indicated by the green dots and the red squares, respectively. The open square and the open circle identify the centroids of the two clusters. (B) The percentage of CDR3 length distributions in the spectratypes of the age-matched controls and MDS patients that were assigned to the “abnormal” cluster, by Vβ family.

