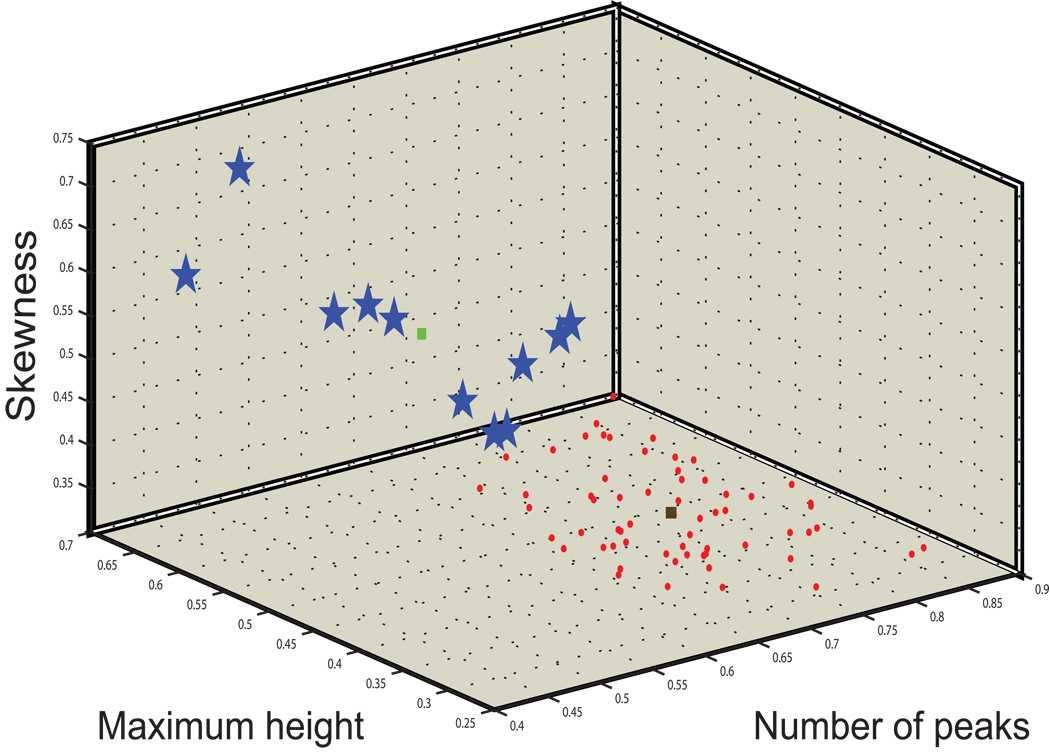
Figure 3. K-means clustering of TCR β spectratypes.
The spectratypes from 50 MDS patients and 23 age-matched controls were clustered on the basis of their number of peaks, maximum relative height, skewness, and kurtosis. Two clusters are evident – one (red squares) characterized by high number of peaks, low maximum relative height, low skewness, and low kurtosis (kurtosis is not plotted in this three-dimensional representation), and another cluster with the opposite characteristics (blue stars). The brown and green squares identify the centroids of the normal and abnormal clusters, respectively. The “normal” cluster contains the spectratypes of all the age-matched controls and 39 MDS patients, while the abnormal cluster contains the spectratypes of 11 MDS patients.

