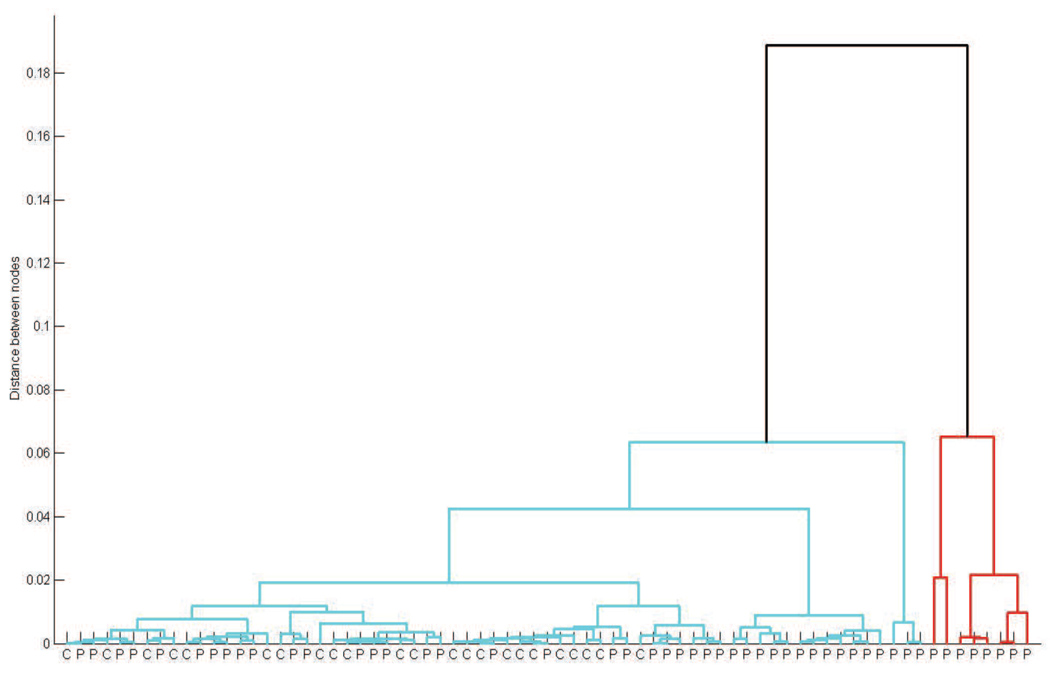
Figure 5. Hierarchical clustering of TCR β spectratypes.
Dendrogram depicting the results of hierarchical clustering of TCR β spectratypes from the 50 MDS patients and 23 age-matched controls. Each branch in the lowest level of the dendrogram represents the spectratype of a single patient (P) or control (C).

