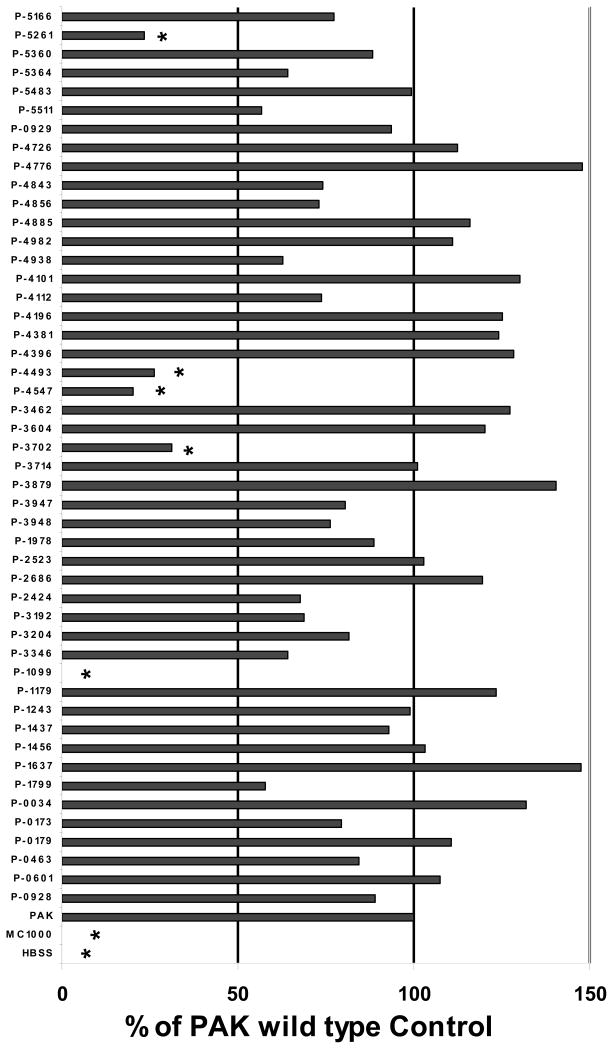
Figure 2.
P. aeruginosa response regulator mutants induce PMN migration across A549 monolayers grown on Transwells at infection concentrations of 1 × 10⁵ CFUs/monolayer. Each individual assay consisted of three wells per condition. Conditions for each assay include infection with twelve distinct mutants, a PAK wild type positive control, and a non-pathogenic E. coli (MC1000) infected negative control. Uninfected (HBSS) monolayers were also included in each assay serving as an additional negative control. Mutants PAΔ(ORF disrupted) are referred to as P-(ORF disrupted), for example a mutant of ORF PA1099 referred to in the text as PAΔ1099 is depicted in this figure as P-1099. All forty eight mutants were screened over the course of at least eight separate assays with each individual mutant tested on at least two separate occasions. The PMN transmigration response was internally controlled in each assay by setting the number of PMNs migrating in response to PAK to 100% and reporting each mutant as a percentage of the PAK wild type control. Data from all individual assays has been combined and presented herein. Mutants that fall below the 50% response threshold and reach statistical significance by Student’s T-test when compared with the response to PAK are reflected by the symbol (*) above the data bar (p < 0.05).

