
Figure 6.
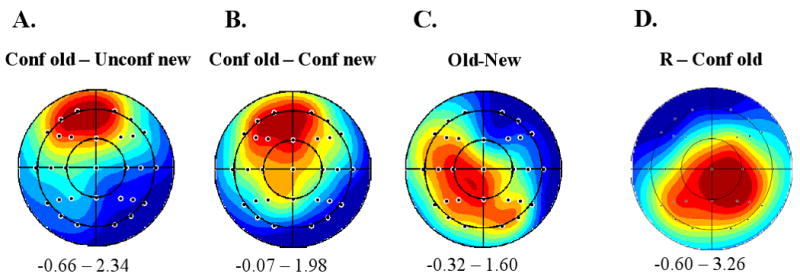
A: Scalp topography of the mean amplitude difference in the 300-500 ms latency region between ERPs associated with ‘confident old’ vs. ‘unconfident new’ judgments made on studied test items; B: Topography of the equivalent effect for test items collapsed across study status; C: Topography of the amplitude difference in the 300-500 ms latency region between ERPs elicited by studied and unstudied items equated for familiarity; D: Topography of the mean amplitude difference in the 500-800 ms latency range between ERPs associated with ‘recollect’ and ‘confident old’ judgments. Plots are range-normalized (red = positive, blue = negative) with the range in microvolts displayed under each plot. The nose is located at the top of each plot.