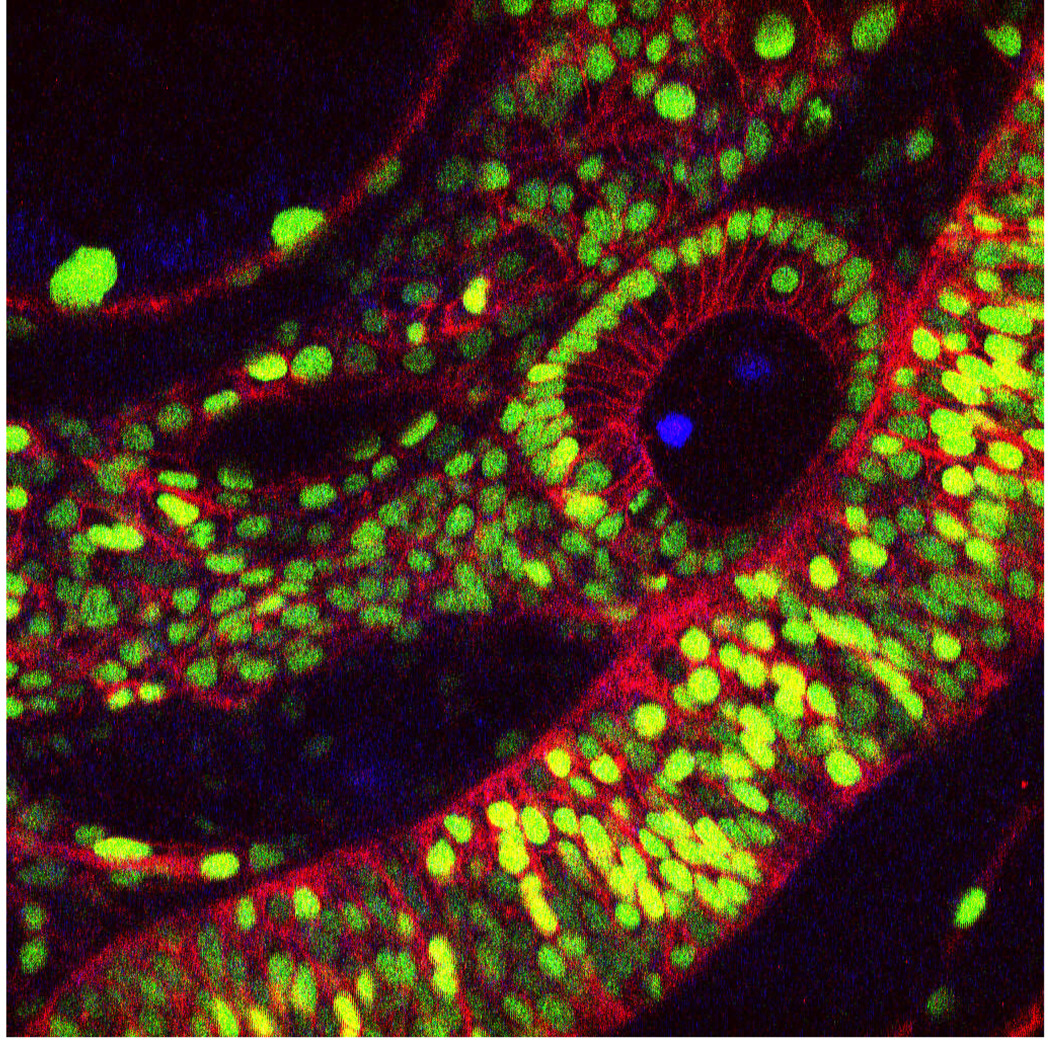
Figure 4.

A single xy image extracted from a very large in toto image to show a typical image. This image is a dorsal-lateral view of the otic vesicle and hindbrain. Nuclei are marked in green with H2B-EGFP and cell membranes are marked in red with a membrane localized mCherry.
