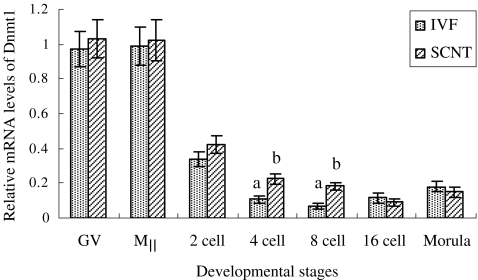
Fig. 6.
The relative expression level of Dnmt1 mRNA in porcine oocytes and embryos. The reaction was conducted in triplicate for each sample. Date are presented as mean ± SEM(bars). a,b Values with different letter superscripts on bars are significant difference( P < 0.05) in the relative Dnmt1 transcript abundance between in IVF and SCNT embryos at given stage of development

