
Figure 1. BOLD Response in vACC to Faces.
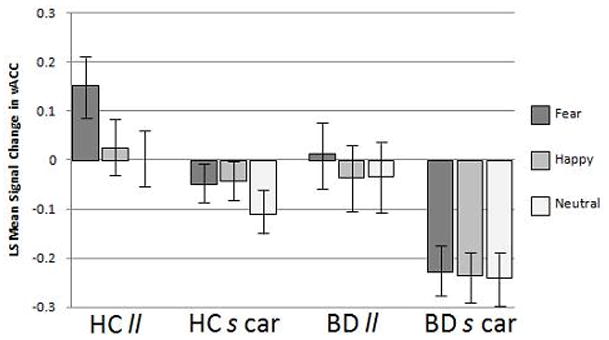
The graph displays the BOLD signal change to faces depicting fearful, happy and neutral expressions (ls mean ± standard error) by group [healthy comparison (HC) and bipolar disorder (BD)] and genotype [homozygous for the 5-HTTLPR “l” allele (ll) and s carriers heterozygous and homozygous for the “s” allele (s car)] for the ventral anterior cingulate cortex (vACC) demonstrating the lowest signal in BD s carriers.