
Figure 2. Localization of BOLD Response Differences in vACC to Faces Depicting Fearful Expressions.
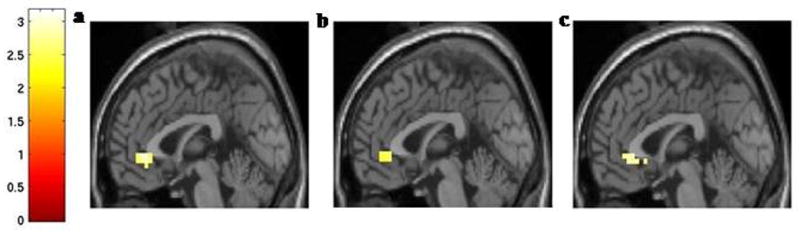
The mid-sagittal images (x = 0 mm) show the vACC region where activation to fear faces was decreased in (a) the BD group compared to the HC group, (b) the HC s carrier group compared to the HC ll group, and (c) the BD s carriers compared to the BD ll group (all at p < 0.01, uncorrected) displayed on an average T1 structural MRI template.