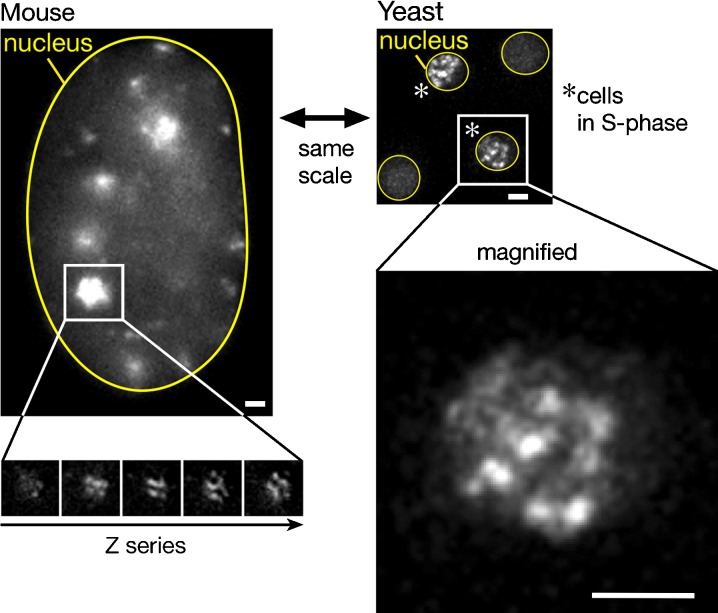
Fig. 3.
Comparing the size of replication factories and the nucleus between budding yeast and mammalian cells. The subnuclear localization of PCNA fused with GFP during S phase in a mouse cell (top left; scale bar 1 µm; adapted from © Leonhardt et al. (2000) with permission) and in budding yeast (top right, asterisks; scale bar 1 µm). A magnified image of the yeast nucleus is also shown (bottom right). The nuclei of yeast and mouse cells are outlined in yellow for comparison of their sizes. Note that a large factory is composed of several small ones in a mouse cell (Leonhardt et al. 2000; Z series, bottom left)

